
Why not trust what the CBO says?
CBO Admits (Very Quietly) That HR 3200 Will Reduce Costs | Health | Change.org
CBO doubles some health care spending estimates – This Just In - CNN.com Blogs
Douglas Elmendorf, the CBO director, said the latest report "updates and expands" on the previous report. He noted that assessing effects on discretionary spending was speculative because such appropriations require congressional action, and could be larger or smaller than initially anticipated.
CBO: Health Care Bill Will Cost $115 Billion More Than Previously Assessed - Political Punch - ABC News
Greenspan on Heath Care Costs: Severe Consequences if CBO is Wrong - Political Punch - ABC News
You have posted forecasts by the CBO. I have posted ex post data from the CBO. Do you not see the difference? Forecasting is trying to predict the future. Accounting is determining what happened in the past. Forecasting accurately is extraordinarily difficult. People change forecasts constantly because the future is inherently unknowable.
The CBO data is consistent with the GAO data which is consistent with the Treasury data.
I trust the public information found under the Federal Treasury Government Link. I'm not following ideology, but I'm looking to the facts between Federal Government DEBT and DEFICIT Source: Debt to the Penny (Daily History Search Application) (this TreasuryDirect Government site allows you to go into a History search to show you the Outstanding Federal Debt). Why does the public debt continue to go up during the Clinton administration?
Here is a listing of the Public Debt for prior fiscal years under President Bill Clinton:
09/29/1995 .... $4,973,982,900,709.39
09/30/1996 .... $5,224,810,939,135.73
09/30/1997 .... $5,413,146,011,397.34
09/30/1998 .... $5,526,194,008,897.62
09/30/1999 .... $5,656,270,901,615.43
Source: History of the U.S. public debt - Wikipedia, the free encyclopedia
Can you explain the reason behind the INCREASE in the Federal debt ceiling during Clinton's term?
April 6, 1993 .. $4,370,000,000,000
Aug 10, 1993 .. $4,900,000,000,000
Mar 29, 1996 .. $5,500,000,000,000
Aug 5, 1997 .... $5,950,000,000,000
June 11, 2002 . $6,400,000,000,000 (under President George W Bush, the same gradual increase in the debt ceiling is shown to have be made)
Source: United States public debt - Wikipedia, the free encyclopedia
I'm not arguing that the national debt didn't go down. I'm explaining how the government can run a surplus while the national debt rises, which I do here.
It is factually incorrect to deduce changes in the national debt as indicative of the government's budgetary balance. The national debt is partly a function of inter-governmental accounting, which does not give an accurate assessment of the financial health of the US government because it only looks at one side of the balance sheet.
The national debt is gross debt, not net debt. This is from the link you cite below. As you can see, gross debt rose.
The way the government accounts for its books, if there was economic growth and the government spent exactly zero dollars more than the year before, the national debt - which is gross debt - would still rise, all else being equal, because taxes flowing into the trusts automatically trigger buying of government securities. But the net debt would not rise because there would be a concurrent rise in asset value of the trusts, which are government agencies.
Yes the deficit went down, but at the cost of the Federal Debt. See Deficit vs Federal Debt Graphs - usgovernment link: United States Debt Deficit History - Charts Following this government link you will see TWO groups of graphs; one that focuses on Government Debt since 1900, followed by a set graphs that shows the Government Deficit. The graphs will show the Deficit did go down, but at the cost of the Federal Debt which continued to go up.
The deficit was eliminated. It wasn't just reduced. There was a surplus. Here is the graph from the link you provided.
See?
This is not about whether or not the gross national debt rose. This is about whether or not there were surpluses in the 1990s. And there were.
What matters in this discussion is not that gross debt rose in the 1990s. What matters is that net debt fell. If the government was running surpluses, you would expect to see a decline in the national net debt, all else being equal.
And it did.
United States Total Government Net Debt (% of GDP) data, Total Government Net Debt (% of GDP) United States
This is net debt to GDP. Net debt to GDP can fall if GDP is rising faster than the growth of debt. But you can see that net debt to GDP fell from 54% in 1995 to 35% in 2000. That is due both to a rise in nominal GDP and a decline in total net debt.
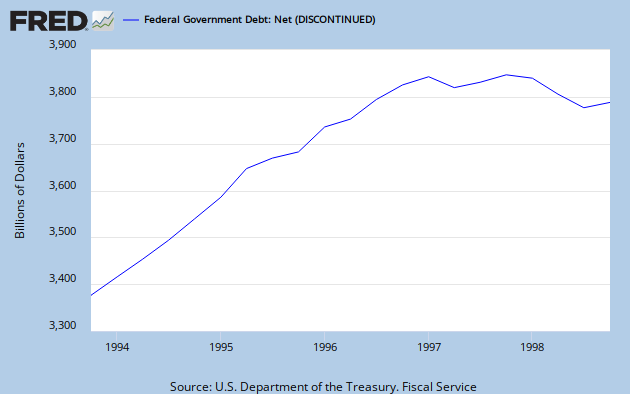
And, as you can see, total net federal government debt declined in the last years of the 1990s.
Last edited: