CrusaderFrank
Diamond Member
- May 20, 2009
- 148,629
- 71,937
- 2,330
Once again we have an idiot demonstrating his idiocy. This is what matters;
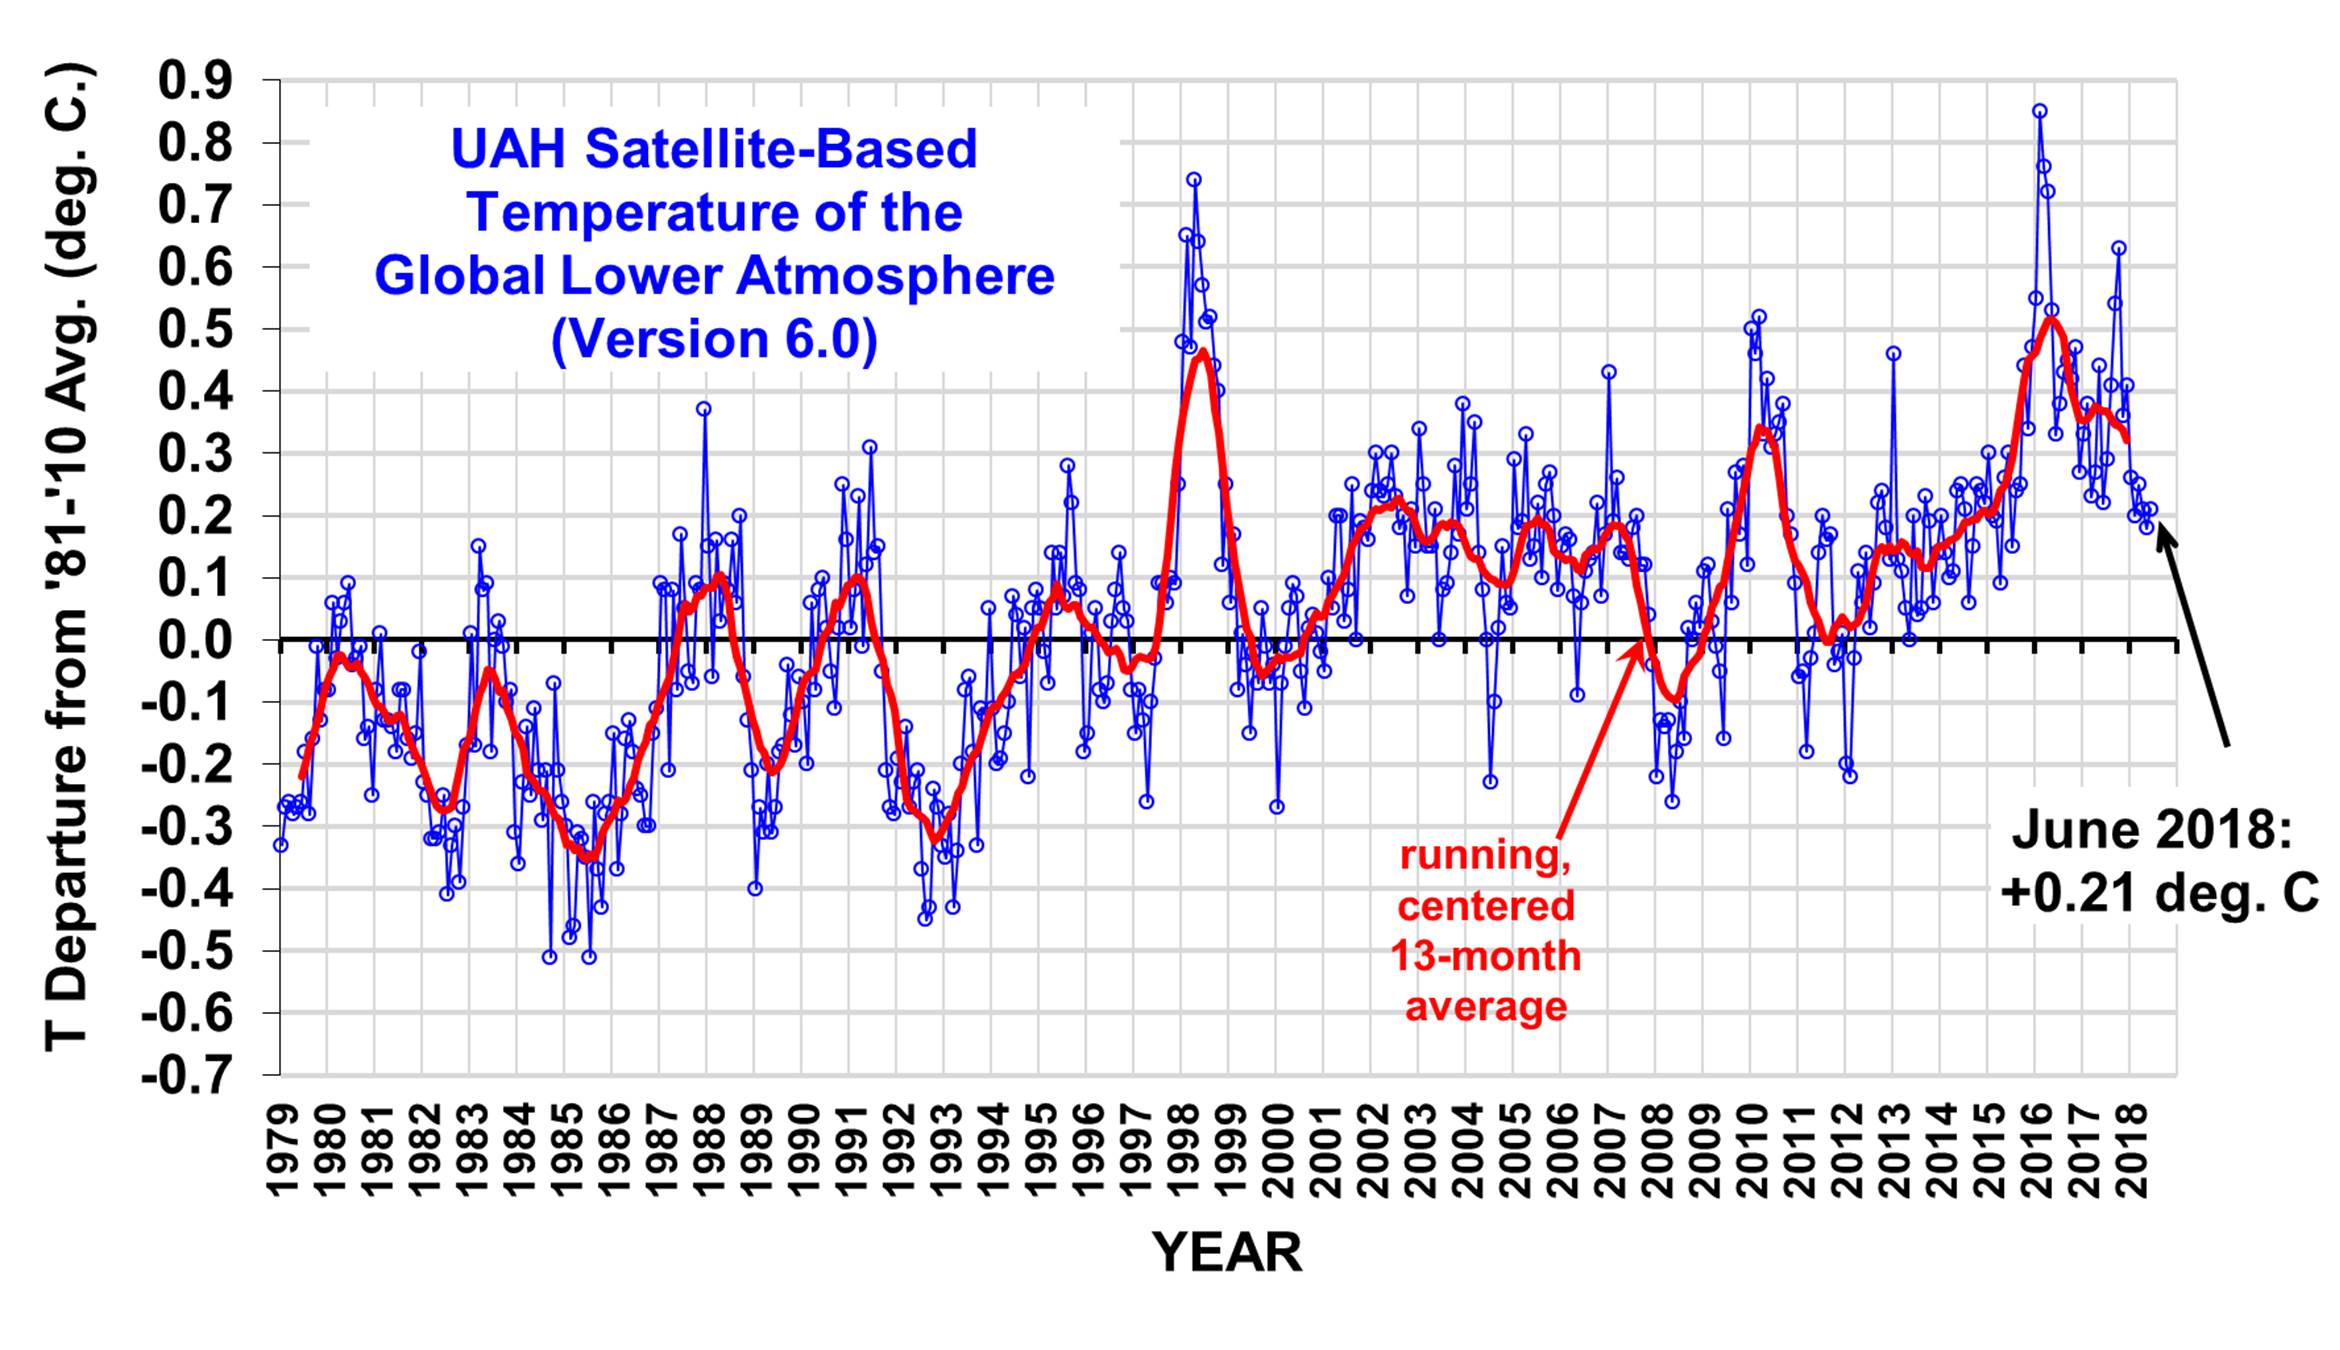
UAH Global Temperature Update for June, 2018: +0.21 deg. C « Roy Spencer, PhD
Look at where the average is now, compared to where it was 40 years ago. When this graph started, we were in a La Nina. The temperature was at -0.3. About 1985, in a La Nina, it went down as far as -0.5. The lowest it has been in the La Nina just ended was 0.19. That is about a 0.7 jump in just 40 years. And we are headed for an El Nino by the end of this year. How high will that go?
AGW cult responds, "How high would you like it to go?"