Who cares about these "hundreds of..."....?
It was the crappy Mauna Loa Station that came up with the Keeling Curve, long before these other 'hundreds of other stations" even existed.
Mauna Loa agrees with other monitoring stations.
Eg here are four monitoring station records including Mauna Loa from the early 70s:
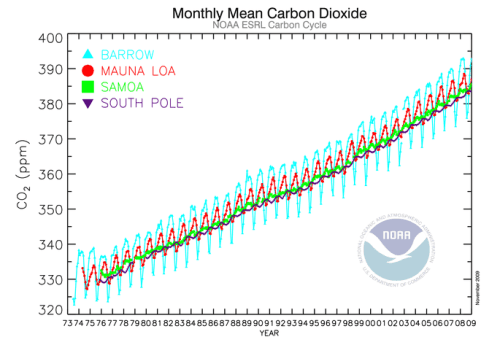
We still have the keeling curve. But we have so many other records too. They are all consistent.
So you claim the trend is just emissions of the Mauna Loa volcano? This doesn't make sense. A site at the South Pole and in Alaska show the same trend. It can't be the Mauna Loa volcano or any other local cause.
So all these stations are by happy coincidence next to completely different emitters of CO2 that produce the exact same trend over time? No thank you, that's a ludicrous idea. Quite clearly these sites are measuring the actual increase in global CO2 concentration over time. We even have satellites detecting the same ~2ppm increase year on year that these hundreds of ground, tower and aircraft measurements are also detecting.
It's collaborated beyond any semblance of reasonable doubt.
If you want education, read this:
Mauna Loa is a volcano
"It's collaborated beyond any semblance of reasonable doubt."
I`ve just shown you what kind crap equipment this "science" is using to generate these results...wanna see it again...:
And You "counter" with a silly graph of 3 other stations which happen to overlap with Mauna Loa...
I don't think you even believe your own words.
First you argued that the Mauna Loa data was wrong because it's next to a volcano.
Now you are arguing that it's wrong and other station data is wrong because it's all faked.
So what was the relevance of the volcano at one of the stations if it's all being faked anyway?
The paper you cite actually lists problems and how they were overcome. Besides if there was a conspiracy of faking the data, why are they bothering to list equipment errors in a paper for your benefit?
Here's the forest:
ESRL Global Monitoring Division - Data Visualization
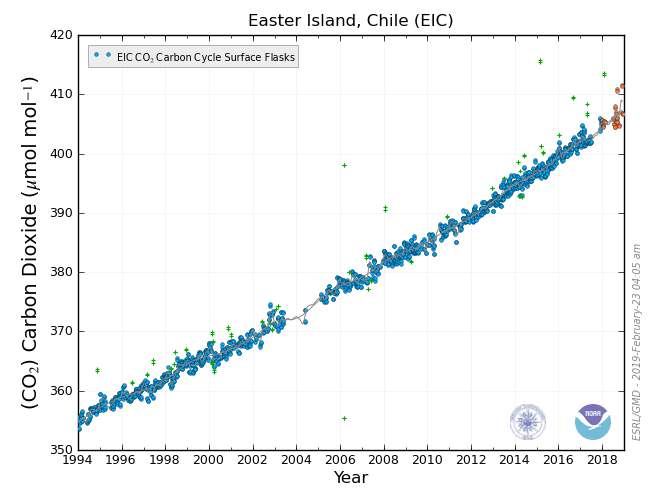
It's not just four stations measuring CO2. Here's another one of them, from Easter Island:
Now you claim to believe in a grand conspiracy theory wherein all these measuring sites have faked the data. I don't buy it for a minute, you seem bright enough and this particular conspiracy theory puts makes 9/11 truthers look like intellectual geniuses in comparison.
So why are you pretending to believe a conspiracy theory when you clearly have no will or want to do so? Are you perhaps just trying to deny some science for political reasons?
I think so, because you really haven't thought it through.
The conspiracy theory involves:
1) CO2 levels have actually remained at (lets say) 300ppm, but scientists have faked a rise to a modern day level approaching 400ppm. (I wonder if you've even considered exactly what you are arguing CO2 has done if the CO2 data is wrong)
2) Hundreds of measurements from monitoring stations, aircraft and tall towers have been systematically binned and substituted with fake data.
3) The conspiracy is global involving scientists from different countries around the world.
4) Somewhere in a tower sits an overlord commanding all these scientists. Presumably he is not named Charles Keeling or else he is channeling these commands from beyond the grave....
5) The AIRS satellite is also involved in the conspiracy. It did not measure 300ppm when it came online, but measured the same approach to 400ppm that the stations measure. The conspiracy deepens.

CO2 Global
6) No person in any country on Earth can set up a gas monitoring station and discover the truth because...well somehow the scientists have international reaching powers to prevent this.
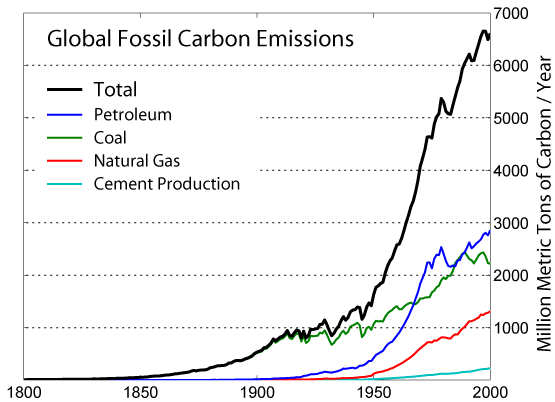
7) The 30 billion tons of CO2 we emit into the atmosphere each year somehow just disappears and doesn't accumulate. There must be magic scrubbers fitted by the auto manufacturers, or perhaps the governments of the world are sucking CO2 from the atmosphere at a secret base.
No-one sane would believe such a ludicrous conspiracy theory. Give me a break in thinking that even you do.
Stop trying to deny so hard. Like obvious troll, it's obvious.