Wehrwolfen
Senior Member
- May 22, 2012
- 2,750
- 340
- 48
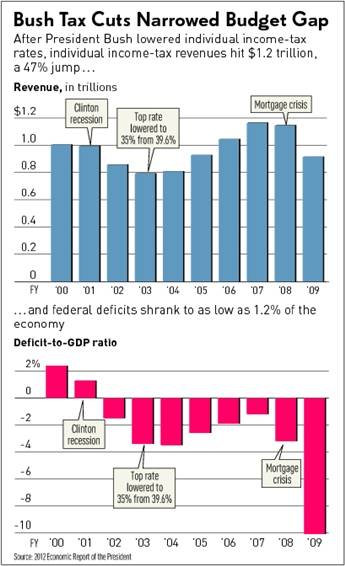
Obama’s Deficit Lies Exposed in Three Easy to Read Charts
by Jim Hoft
December 2, 2012
Throughout his first term and during the recent campaign Barack Obama blamed the Bush tax cuts for the trillion dollar deficits.
[ame=http://www.youtube.com/watch?v=jC9-YC9W4aA]President Obama : Bush tax cuts caused deficit - YouTube[/ame]
It was a lie. He knew it was a lie. The media knew it was a lie. They let him get away with it anyway.
The truth is federal revenues went up after passing the Bush tax cuts and the deficit went down.
IBD reported:
While President Obama insists the Bush tax cuts caused the recession and record deficits, his own economists say otherwise.
He might want to consult their data for the truth.
Kicking off fiscal cliff negotiations last month, Obama said: “What I’m not going to do is extend Bush tax cuts for the wealthiest 2% that we can’t afford and, according to economists, will have the least positive impact on our economy.”
During the White House press conference, he added, “If we’re going to be serious about deficit reduction, we’ve got to do it in a balanced way.”
Obama argued voters made it clear in the election that they don’t want to go back to Republican policies that “cost” the Treasury revenues and “blew up the deficit,” as he told them repeatedly during the campaign.
The Washington media by and large share these assumptions. And they’re driving the debate over what to do about the federal budget crisis before Jan. 1, when the tax cuts and spending programs are set to expire.
But the assumptions are faulty, based largely on political demagoguery rather than hard numbers — including ones certified by Obama’s own fiscal policy advisers and bean counters in the White House. . . . Based on Bush fiscal policies, the nonpartisan Congressional Budget Office projected budget deficits of 0.7% to 1.5% of GDP for the years 2008 through 2011. The CBO even predicted surpluses for the subsequent years through 2018. . . . Obama’s economic report shows that the average deficit-to-GDP ratio during the entire Bush administration — 2001 to 2009 — was 2%, which is well below the 50-year average of 3%. During the Obama years, in contrast, the same deficit ratio has averaged 9.1%.
Read more:
http://www.thegatewaypundit.com/2012/12/obamas-deficit-lies-exposed-in-three-easy-charts/
Last edited: