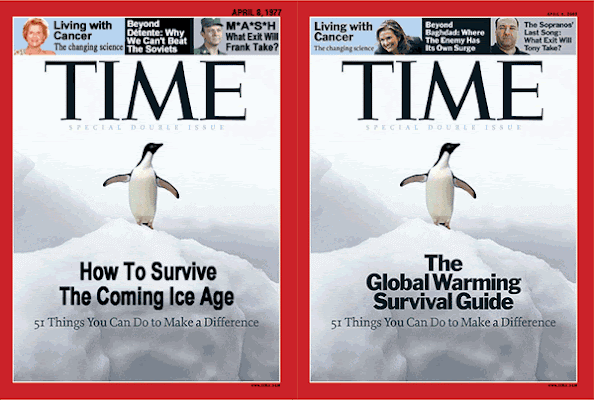
News flash for flat-earthers

Okay, FactDenier, you obviously aren't going to admit you were wrong that the earth has been "trending" warmer for the "last seven years". The PhD trained scientists at NASA proved you wrong, and you dissapeared from the thread.

Obviously, this suggests you are all about lying about the facts, and you are emotionally bonded to denying the scientic facts, per the orders you recieved from sean hannity.

FactDenier, I'm going to be watching to see if you try to post your bullshit again about the "warming trend" for the last seven years, because I know exactly where to get the NASA temperature trend analysis and I'm going to shove it in your lying face every time you try to post your bullshit

Go for it. The trend is down. Period. Your own red line shows the downward trend. Your hufffy puffy act is just that.

And you lie to support a political point of view concerning a scientific subject. A sad case of intellectual and personal dishonesty.
 
Fig2b.gif


Draw the trend line from 1998. You will see it is clearly down.

Draw the line from 1992, you will see the line is clearly down. Factfinder, are you trying for the stupidity of the day award?
 
Global Temperature Trends From 2500 B.C. To 2040 A.D.
Until recently, global temperatures were more than a degree Fahrenheit warmer when compared to the overall 20th Century mean. From August of 2007 through February of 2008, the Earth’s mean reading dropped to near the 200-year average temperature of 57 degrees. (See Long-Term Chart Below.)

We, Cliff Harris and Randy Mann, believe that the warming and even the cooling of global temperatures are the result of long-term climatic cycles, solar activity, sea-surface temperature patterns and more. However, Mankind’s activities of the burning of fossil fuels, massive deforestations, the replacing of grassy surfaces with asphalt and concrete, the ‘Urban Heat Island Effect,’ are making conditions ‘worse’ and this will ultimately enhance the Earth’s warming process down the meteorological roadway in the next several decades.

Global Temperature Trends Since 2500 B.C.

Check out the chart at the bottom of the article.
 
c) global warming does not predict every single year will be warmer than the last, only that the general trend will be upwards

Except the general trend has been down for the last seven years.


why exactly do you feel compelled to lie on this issue?

We can start with one simple premise: the Phd-trained scientists at NASA know more about trend analysis than you do.

This is NASA's graph of global mean temp. The red line is their trend analyis of average global mean temp., which shows a steady upward trend over the last seven years, over the last decade, and indeed over the last half century.

Fig.A.lrg.gif


You and the other flat earthers have two choices now.

You can either admit you were wrong about the temperature trends.

Or, you can go back to lying that the earth has been cooling for the last seven years.


My guess? You're going to go back to lying, because you are invested in this issue in an emotional, partisan way....and you don't care about scientific facts

Why is it that you always post data that ENDs almost ten years ago?
 
FactFinder just hit the nail on the head "it depends on where you start".

As I said to the flat earthers ... ignoring evidence that shows you are wrong does not make you right.
 
Fig2b.gif


Draw the trend line from 1998. You will see it is clearly down.

Draw the line from 1992, you will see the line is clearly down. Factfinder, are you trying for the stupidity of the day award?

DUH, the temperature peak was 1998.

Double DUH, the temperature, on this chart, was at a minimum in 1992. Just as legal to pick that for a starting point as it is to pick 1998. Or any other year.

This is called cherry picking. A subterfuge of simple minds when faced with facts that they dislike. Wrong scientifically, but what the hell, it is the politics that are important to such minds, not the science.

To small minds, truth is secondary to ideology.

Yet you don't even see the possibility of your own cherry picked scientists cherry picking data to make you buy more "green"?

That's ... well ... stupid.
 
c) global warming does not predict every single year will be warmer than the last, only that the general trend will be upwards

Except the general trend has been down for the last seven years.


why exactly do you feel compelled to lie on this issue?

We can start with one simple premise: the Phd-trained scientists at NASA know more about trend analysis than you do.

This is NASA's graph of global mean temp. The red line is their trend analyis of average global mean temp., which shows a steady upward trend over the last seven years, over the last decade, and indeed over the last half century.

Fig.A.lrg.gif


You and the other flat earthers have two choices now.

You can either admit you were wrong about the temperature trends.

Or, you can go back to lying that the earth has been cooling for the last seven years.


My guess? You're going to go back to lying, because you are invested in this issue in an emotional, partisan way....and you don't care about scientific facts

Why is it that you always post data that ENDs almost ten years ago?


why the hell don't you learn to read graphs before you post something idiotic like this? the data on the graph is through 2007
 
Draw the line from 1992, you will see the line is clearly down. Factfinder, are you trying for the stupidity of the day award?

DUH, the temperature peak was 1998.

Double DUH, the temperature, on this chart, was at a minimum in 1992. Just as legal to pick that for a starting point as it is to pick 1998. Or any other year.

This is called cherry picking. A subterfuge of simple minds when faced with facts that they dislike. Wrong scientifically, but what the hell, it is the politics that are important to such minds, not the science.

To small minds, truth is secondary to ideology.

Again,,,,I stated the trend has been down for the last seven years The trend has been down for the last 10. I also acknowledge that we were at the peak of warming in 1998. We have been cooling down since then with 2008 being the most daramatic.

http://www.crh.noaa.gov/mqt/?n=lake_superior_ice

Due to the recent cold spell and below normal temperatures for much of the winter of 2008-2009, ice covers nearly all of Lake Superior. Only small areas of open water remain. This image was taken on Tuesday, March 3rd. If arctic air does not return in the next couple of weeks, it is likely that this will be the day of maximum ice cover on Lake Superior for this winter as warmer weather and periods of stronger winds through the end of this week will cause open water areas to expand. Click on the image to view a higher resolution satellite picture (image is large -- just under 1mb).


Lake Superior also froze over in 2003. This is only supposed to happen once every 20 years.
 
why exactly do you feel compelled to lie on this issue?

We can start with one simple premise: the Phd-trained scientists at NASA know more about trend analysis than you do.

This is NASA's graph of global mean temp. The red line is their trend analyis of average global mean temp., which shows a steady upward trend over the last seven years, over the last decade, and indeed over the last half century.

Fig.A.lrg.gif


You and the other flat earthers have two choices now.

You can either admit you were wrong about the temperature trends.

Or, you can go back to lying that the earth has been cooling for the last seven years.


My guess? You're going to go back to lying, because you are invested in this issue in an emotional, partisan way....and you don't care about scientific facts

Why is it that you always post data that ENDs almost ten years ago?


why the hell don't you learn to read graphs before you post something idiotic like this? the data on the graph is through 2007

Really ... look at it. Each "block" displays 5 years (approx.) and the last one ends almost half way through the 2005 block ... making it about 2003. Not exactly 10 years but if flat earthers can exaggerate so can I.
 
DUH, the temperature peak was 1998.

Double DUH, the temperature, on this chart, was at a minimum in 1992. Just as legal to pick that for a starting point as it is to pick 1998. Or any other year.

This is called cherry picking. A subterfuge of simple minds when faced with facts that they dislike. Wrong scientifically, but what the hell, it is the politics that are important to such minds, not the science.

To small minds, truth is secondary to ideology.

Yet you don't even see the possibility of your own cherry picked scientists cherry picking data to make you buy more "green"?

That's ... well ... stupid.

Kitten, that is just plain stupid. Ice caps, glaciers, and snow packs don't cherry pick. The data from every source says clearly that we are rapidly warming. The physics of CO2 says that when you have more in the atmosphere, the atmosphere will absorb more heat. That is not cherry picking, that is facts and observations.

Cherry picking ... 100% ... ignoring all other observations and facts except these two is the worse kind of cherry picking.
 
Global Temperature Trends From 2500 B.C. To 2040 A.D.
Until recently, global temperatures were more than a degree Fahrenheit warmer when compared to the overall 20th Century mean. From August of 2007 through February of 2008, the Earth’s mean reading dropped to near the 200-year average temperature of 57 degrees. (See Long-Term Chart Below.)

We, Cliff Harris and Randy Mann, believe that the warming and even the cooling of global temperatures are the result of long-term climatic cycles, solar activity, sea-surface temperature patterns and more. However, Mankind’s activities of the burning of fossil fuels, massive deforestations, the replacing of grassy surfaces with asphalt and concrete, the ‘Urban Heat Island Effect,’ are making conditions ‘worse’ and this will ultimately enhance the Earth’s warming process down the meteorological roadway in the next several decades.

Global Temperature Trends Since 2500 B.C.

Check out the chart at the bottom of the article.
Global Temperature Trends From 2500 B.C. To 2040 A.D.
Until recently, global temperatures were more than a degree Fahrenheit warmer when compared to the overall 20th Century mean. From August of 2007 through February of 2008, the Earth’s mean reading dropped to near the 200-year average temperature of 57 degrees. (See Long-Term Chart Below.)

We, Cliff Harris and Randy Mann, believe that the warming and even the cooling of global temperatures are the result of long-term climatic cycles, solar activity, sea-surface temperature patterns and more. However, Mankind’s activities of the burning of fossil fuels, massive deforestations, the replacing of grassy surfaces with asphalt and concrete, the ‘Urban Heat Island Effect,’ are making conditions ‘worse’ and this will ultimately enhance the Earth’s warming process down the meteorological roadway in the next several decades.

From the late 1940s through the early 1970s, a climate research organization called the Weather Science Foundation of Crystal Lake, Illinois, determined that the planet’s warm, cold, wet and dry periods were the result of alternating short-term and long-term climatic cycles. These researchers and scientists also concluded that the Earth’s ever-changing climate likewise has influenced global and regional economies, human and animal migrations, science, religion and the arts as well as shifting forms of government and strength of leadership.

Much of this data was based upon thousands of hours of research done by Dr. Raymond H. Wheeler and his associates during the 1930s and 1940s at the University of Kansas. Dr. Wheeler was well-known for his discovery of various climate cycles, including his highly-regarded ‘510-Year Drought Clock’ that he detailed at the end of the ‘Dust Bowl’ era in the late 1930s.

During the early 1970s, our planet was in the midst of a colder and drier weather cycle. Inflationary recessions and oil shortages led to rationing and long gas lines at service stations worldwide. The situation at that time was far worse than it is now, at least for the time being.

The Weather Science Foundation also predicted, based on these various climate cycles, that our planet would turn much warmer and wetter by the early 2000s, resulting in general global prosperity. They also said that we would be seeing at this time widespread weather ‘extremes.’ There’s little doubt that most of their early predictions came true.

Our recent decline in the Earth’s temperature may be a combination of both long-term and short-term climate cycles, decreased solar activity and the development of a strong long-lasting La Nina, the current cooler than normal sea-surface temperature event in the south-central Pacific Ocean. Sunspot activity in the past 18 months has decreased to the lowest levels since ‘The Little Ice Age’ ended in the mid-to late 1800s. This "cool spell," though, may only be a brief interruption to the Earth’s overall warming trend. Only time will tell.

Based on these predictions, it appears that much warmer readings may be expected for Planet Earth, especially by the 2030s, that will eventually top 1998's global highest reading of 58.3 degrees. It’s quite possible we could see an average temperature in the low 60s. Until then, this ‘cooling period’ may last from just a few months to as long as several years, especially if sunspot activity remains very low.
We at Harris-Mann Climatology, Long Range Weather Trends, Weather Records and Extremes, Weather and Climate History, Daily Forecast Services, believe that our prolonged cycle of wide weather ‘extremes,’ the worst in at least 1,000 years, will continue and perhaps become even more severe, especially by the mid 2010s. We should see more powerful storms, including major hurricanes and increasing deadly tornadoes. There will likewise be widespread flooding, crop-destroying droughts and freezes and violent weather of all types including ice storms, large-sized hail and torrential downpours
 
Global Temperature Trends From 2500 B.C. To 2040 A.D.
Until recently, global temperatures were more than a degree Fahrenheit warmer when compared to the overall 20th Century mean. From August of 2007 through February of 2008, the Earth’s mean reading dropped to near the 200-year average temperature of 57 degrees. (See Long-Term Chart Below.)

We, Cliff Harris and Randy Mann, believe that the warming and even the cooling of global temperatures are the result of long-term climatic cycles, solar activity, sea-surface temperature patterns and more. However, Mankind’s activities of the burning of fossil fuels, massive deforestations, the replacing of grassy surfaces with asphalt and concrete, the ‘Urban Heat Island Effect,’ are making conditions ‘worse’ and this will ultimately enhance the Earth’s warming process down the meteorological roadway in the next several decades.

Global Temperature Trends Since 2500 B.C.

Check out the chart at the bottom of the article.
Global Temperature Trends From 2500 B.C. To 2040 A.D.
Until recently, global temperatures were more than a degree Fahrenheit warmer when compared to the overall 20th Century mean. From August of 2007 through February of 2008, the Earth’s mean reading dropped to near the 200-year average temperature of 57 degrees. (See Long-Term Chart Below.)

We, Cliff Harris and Randy Mann, believe that the warming and even the cooling of global temperatures are the result of long-term climatic cycles, solar activity, sea-surface temperature patterns and more. However, Mankind’s activities of the burning of fossil fuels, massive deforestations, the replacing of grassy surfaces with asphalt and concrete, the ‘Urban Heat Island Effect,’ are making conditions ‘worse’ and this will ultimately enhance the Earth’s warming process down the meteorological roadway in the next several decades.

From the late 1940s through the early 1970s, a climate research organization called the Weather Science Foundation of Crystal Lake, Illinois, determined that the planet’s warm, cold, wet and dry periods were the result of alternating short-term and long-term climatic cycles. These researchers and scientists also concluded that the Earth’s ever-changing climate likewise has influenced global and regional economies, human and animal migrations, science, religion and the arts as well as shifting forms of government and strength of leadership.

Much of this data was based upon thousands of hours of research done by Dr. Raymond H. Wheeler and his associates during the 1930s and 1940s at the University of Kansas. Dr. Wheeler was well-known for his discovery of various climate cycles, including his highly-regarded ‘510-Year Drought Clock’ that he detailed at the end of the ‘Dust Bowl’ era in the late 1930s.

During the early 1970s, our planet was in the midst of a colder and drier weather cycle. Inflationary recessions and oil shortages led to rationing and long gas lines at service stations worldwide. The situation at that time was far worse than it is now, at least for the time being.

The Weather Science Foundation also predicted, based on these various climate cycles, that our planet would turn much warmer and wetter by the early 2000s, resulting in general global prosperity. They also said that we would be seeing at this time widespread weather ‘extremes.’ There’s little doubt that most of their early predictions came true.

Our recent decline in the Earth’s temperature may be a combination of both long-term and short-term climate cycles, decreased solar activity and the development of a strong long-lasting La Nina, the current cooler than normal sea-surface temperature event in the south-central Pacific Ocean. Sunspot activity in the past 18 months has decreased to the lowest levels since ‘The Little Ice Age’ ended in the mid-to late 1800s. This "cool spell," though, may only be a brief interruption to the Earth’s overall warming trend. Only time will tell.

Based on these predictions, it appears that much warmer readings may be expected for Planet Earth, especially by the 2030s, that will eventually top 1998's global highest reading of 58.3 degrees. It’s quite possible we could see an average temperature in the low 60s. Until then, this ‘cooling period’ may last from just a few months to as long as several years, especially if sunspot activity remains very low.
We at Harris-Mann Climatology, Long Range Weather Trends, Weather Records and Extremes, Weather and Climate History, Daily Forecast Services, believe that our prolonged cycle of wide weather ‘extremes,’ the worst in at least 1,000 years, will continue and perhaps become even more severe, especially by the mid 2010s. We should see more powerful storms, including major hurricanes and increasing deadly tornadoes. There will likewise be widespread flooding, crop-destroying droughts and freezes and violent weather of all types including ice storms, large-sized hail and torrential downpours

Yep and they don;t believe AGW has a damn thing to do with it.
 

Forum List

Back
Top