More on the Globull Warming Scam

longknife

Diamond Member
Sep 21, 2012
42,221
13,090
2,250
Sin City
Some defenders love to post charts that show how Nature's going to hell in a basket and it's all Mankind's fault. I'm not denying that we're seeing extreme weather all over the place. But, does that make it our fault?


So, I won't post all ten of the charts, just a couple to rile the defenders up a bit.
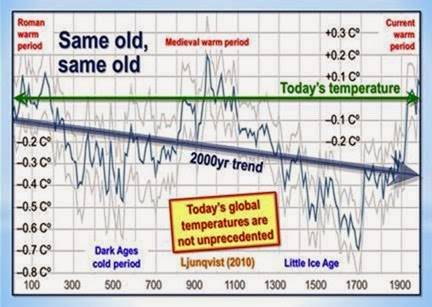
clip_image002_thumb5%255B1%255D.jpg


and


clip_image038_thumb%255B1%255D.jpg


Read more with links @ Doug Ross Journal 10 Startling Charts That Completely Debunk the Global Warming Scam
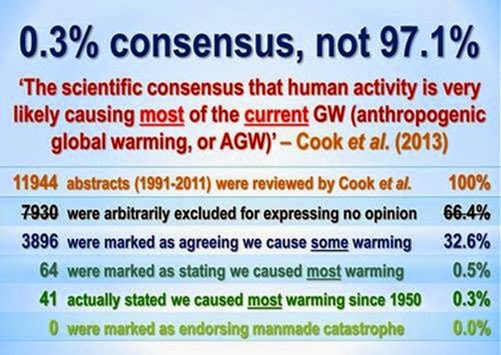
 
The good news is --- there's less and less bogus predictions and charts and more militant political
rhetoric with hints of desperation. The silence you are hearing is REAL science at work trying to patch the gynormous holes in our understanding of the climate systems and enviro impact. Real work gets done better without all the shouting....
 
Please help me out then GoldiRocks. Where is the deluge of NEW temperature predictions showing the Global mean Temp. in 2020? 2050?

You show me how stupid I am. Then I'll show you the newer more rationale work admitting that the Climate system is complicated by longer delays to stimulus, reacts differently in different climate zones, and has unmodeled massive storage effects. We can chat about the REAL work to put all those revelations into BETTER climate models.

Fact is -- what we SEE is that the warming is right in line with the CO2 ONLY estimate of 1degC/doubling. And we ain't even at the 1st doubling since the Industrial Age kicked in.. No magic multipliers. No hysteria to sell...
 
Which is, of course, what the Mann Graph has shown.
Please help me out then GoldiRocks. Where is the deluge of NEW temperature predictions showing the Global mean Temp. in 2020? 2050?

You show me how stupid I am. Then I'll show you the newer more rationale work admitting that the Climate system is complicated by longer delays to stimulus, reacts differently in different climate zones, and has unmodeled massive storage effects. We can chat about the REAL work to put all those revelations into BETTER climate models.

Fact is -- what we SEE is that the warming is right in line with the CO2 ONLY estimate of 1degC/doubling. And we ain't even at the 1st doubling since the Industrial Age kicked in.. No magic multipliers. No hysteria to sell...
OK, predictions.......................

PhysOrg.com) -- Over the past several years, researchers have built a variety of computer simulations created to predict Earth’s climate in the future. Most recently, most models have suggested that over the next fifty years, we’ll see an average worldwide rise in temperature of perhaps 1°C. Now a new group of simulations, using the combined computing power of thousands of personal computers, says that number is too low, and that we might see temperatures rise as much as 3°C, which would of course, be a far more serious situation. The simulations, run by climateprediction.net in conjunction with the BBC Climate Change Experiment, resulted in predictions of a rise in temperature ranging from 1.4°C to 3.0°C by 2050. The large team involved in the project has published their findings in Nature Geoscience.

Read more at: New simulation predicts higher average Earth temperatures by 2050 than other models
 
IPCC - Intergovernmental Panel on Climate Change

3.5. Scenarios of the 21st Century

In 2000, the IPCC completed a Special Report on Emissions Scenarios (SRES) to replace the earlier set of six IS92 scenarios developed for the IPCC in 1992. These newer scenarios consider the period 1990 to 2100 and include a range of socioeconomic assumptions (e.g., global population and gross domestic product). Their implications for other aspects of global change also have been calculated; some of these implications are summarized for 2050 and 2100 in Table TS-1. For example, mean ground-level ozone concentrations in July over the industrialized continents of the northern hemisphere are projected to rise from about 40 ppb in 2000 to more than 70 ppb in 2100 under the highest illustrative SRES emissions scenarios; by comparison, the clean-air standard is below 80 ppb. Peak levels of ozone in local smog events could be many times higher. Estimates of CO2 concentration range from 478 ppm to1099 ppm by 2100, given the range of SRES emissions and uncertainties about the carbon cycle (Table TS-1). This range of implied radiative forcing gives rise to an estimated global warming from 1990 to 2100 of 1.4-5.8°C, assuming a range of climate sensitivities. This range is higher than the 0.7-3.5°C of the SAR because of higher levels of radiative forcing in the SRES scenarios than in the IS92a-f scenarios—primarily as a result of lower sulfate aerosol emissions, especially after 2050. The equivalent range of estimates of global sea-level rise (for this range of global temperature change in combination with a range of ice melt sensitivities) to 2100 is 9-88 cm (compared to 15-95 cm in the SAR). [3.2.4.1, 3.4.4, 3.8.1, 3.8.2]

There you go. Predictions. So make your own, and see who is closest.
 
Global warming isn't like God...it won't disappear if no-one believes in it.
 
This is more 'Science as Decree', which goes back to the dark ages. When the establishment, with a vested interest in a scientific conclusion, squashes alternate theories, moves the goalposts, fakes data sets, masks research methods, & bases their findings on computer models, rather than observable, repeatable science, they have moved into the 'anti-science' camp, & are enemies of the scientific method. They demean true science, & do violence to our knowledge base, using it for a political agenda, rather than discovery.
 
Demonstrate where any of this is being done, and who is doing it. Real scientfic papers, please, not blogs.
Is not! Is too! Nuh uh! Uh huh!

That is all arguments of assertion are. If someone is making a scientific claim.. a 'theory'.. then they post their studies, describe their methodology, & post their conclusions for review. It is up to them to provide evidence for their claim, not for others to dispute some assertion.

Then, based on their models & conclusions, predictions can be made. If these predictions come to pass, it lends validity to the postulate. If they do not, the postulate is discredited. All of the predictions made by AGW advocates have turned out to be hysterical opinions, based on imagined, ginned up, or phony data. Computer models were crafted to prove their hypothesis, but when their predictions missed by a wide margin, the models are shown to be wrong, & it is back to the hypothesis stage.. ..at least, if it was science, that is how it works. If it is propaganda, they gloss over inconsistencies, ignore evidence, & shout louder.

AGW looks & feels like propaganda, not science.
 
Pubs.GISS Hansen et al. 1981 Climate impact of increasing atmospheric carbon dioxide

Hansen et al. 1981

Hansen, J., D. Johnson, A. Lacis, S. Lebedeff, P. Lee, D. Rind, and G. Russell, 1981: Climate impact of increasing atmospheric carbon dioxide. Science, 213, 957-966, doi:10.1126/science.213.4511.957.

The global temperature rose 0.2°C between the middle 1960s and 1980, yielding a warming of 0.4°C in the past century. This temperature increase is consistent with the calculated effect due to measured increases of atmospheric carbon dioxide. Variations of volcanic aerosols and possibly solar luminosity appear to be primary causes of observed fluctuations about the mean trend of increasing temperature. It is shown that the anthropogenic carbon dioxide warming should emerge from the noise level of natural climate variability by the end of the century, and there is a high probability of warming in the 1980s. Potential effects on climate in the 21st century include the creation of drought-prone regions in North America and central Asia as part of a shifting of climatic zones, erosion of the West Antarctic ice sheet with a consequent worldwide rise in sea level, and opening of the fabled Northwest Passage.

Looks like a pretty unequivical prediction that has been spot on. Perhaps you should try reading some of what the real scientists have written instead of the political shit of the rightwing of the GOP.
 
Looks like a pretty unequivical prediction that has been spot on. Perhaps you should try reading some of what the real scientists have written instead of the political shit of the rightwing of the GOP.
There is plenty of information, websites, links, & rebuttals that refute your quote. We are back to an argument by assertion, with no real evidence being submitted.
I can easily say the exact same thing about your 'political shit of the leftwing of the democratic party'.. but how is that an argument? It is a deflection.. a smear when you cannot answer someone's argument.
 
Pubs.GISS Hansen et al. 1981 Climate impact of increasing atmospheric carbon dioxide

Hansen et al. 1981

Hansen, J., D. Johnson, A. Lacis, S. Lebedeff, P. Lee, D. Rind, and G. Russell, 1981: Climate impact of increasing atmospheric carbon dioxide. Science, 213, 957-966, doi:10.1126/science.213.4511.957.

The global temperature rose 0.2°C between the middle 1960s and 1980, yielding a warming of 0.4°C in the past century. This temperature increase is consistent with the calculated effect due to measured increases of atmospheric carbon dioxide. Variations of volcanic aerosols and possibly solar luminosity appear to be primary causes of observed fluctuations about the mean trend of increasing temperature. It is shown that the anthropogenic carbon dioxide warming should emerge from the noise level of natural climate variability by the end of the century, and there is a high probability of warming in the 1980s. Potential effects on climate in the 21st century include the creation of drought-prone regions in North America and central Asia as part of a shifting of climatic zones, erosion of the West Antarctic ice sheet with a consequent worldwide rise in sea level, and opening of the fabled Northwest Passage.

Looks like a pretty unequivical prediction that has been spot on. Perhaps you should try reading some of what the real scientists have written instead of the political shit of the rightwing of the GOP.
so when the one doing the prediction, gets to manipulate data, no wonder the model prediction was right. LOL. Let's see the raw data set charts. Please!!!!!!!!!!!
 
There isn't global data set that supports the last 100 years of your chart. I honeslty don't think what you posted is global...On the otherhand, I do agree that the past 2,000 years had been slowly cooling.

There is nothing fundamentally wrong with the last 100 yrs of that chart. It shows about 0.7degC rise over the industrial period. Hard to read on that scale. But that is the type of scale on which climate should be viewed.
 
Global warming isn't like God...it won't disappear if no-one believes in it.

What needs to disappear are the gross exaggerations and apocalyptic fears that have come from misinterpretations of the results or shoddy modeling. There IS some warming from increased CO2. About a 1degC per doubling of CO2.. But THAT is not sufficient to scare folks. The REST of the hype was manufactured..
 
Well now, we shall see who is correct on this issue.
Pubs.GISS Hansen et al. 1981 Climate impact of increasing atmospheric carbon dioxide

Hansen et al. 1981

Hansen, J., D. Johnson, A. Lacis, S. Lebedeff, P. Lee, D. Rind, and G. Russell, 1981: Climate impact of increasing atmospheric carbon dioxide. Science, 213, 957-966, doi:10.1126/science.213.4511.957.

The global temperature rose 0.2°C between the middle 1960s and 1980, yielding a warming of 0.4°C in the past century. This temperature increase is consistent with the calculated effect due to measured increases of atmospheric carbon dioxide. Variations of volcanic aerosols and possibly solar luminosity appear to be primary causes of observed fluctuations about the mean trend of increasing temperature. It is shown that the anthropogenic carbon dioxide warming should emerge from the noise level of natural climate variability by the end of the century, and there is a high probability of warming in the 1980s. Potential effects on climate in the 21st century include the creation of drought-prone regions in North America and central Asia as part of a shifting of climatic zones, erosion of the West Antarctic ice sheet with a consequent worldwide rise in sea level, and opening of the fabled Northwest Passage.

Looks like a pretty unequivical prediction that has been spot on. Perhaps you should try reading some of what the real scientists have written instead of the political shit of the rightwing of the GOP.
so when the one doing the prediction, gets to manipulate data, no wonder the model prediction was right. LOL. Let's see the raw data set charts. Please!!!!!!!!!!!
So, Hansen cleared all the ice out of the Northwest Passage all by his self. And started the disinigration of the West Antarctic ice sheets on his own. You have seen the raw data charts. They are published by several differant groups. This is just one of them;
Polar Sea Ice Cap and Snow - Cryosphere Today


"Potential effects on climate in the 21st century include the creation of drought-prone regions in North America and central Asia as part of a shifting of climatic zones, erosion of the West Antarctic ice sheet with a consequent worldwide rise in sea level, and opening of the fabled Northwest Passage."
 
Which is, of course, what the Mann Graph has shown.
Please help me out then GoldiRocks. Where is the deluge of NEW temperature predictions showing the Global mean Temp. in 2020? 2050?

You show me how stupid I am. Then I'll show you the newer more rationale work admitting that the Climate system is complicated by longer delays to stimulus, reacts differently in different climate zones, and has unmodeled massive storage effects. We can chat about the REAL work to put all those revelations into BETTER climate models.

Fact is -- what we SEE is that the warming is right in line with the CO2 ONLY estimate of 1degC/doubling. And we ain't even at the 1st doubling since the Industrial Age kicked in.. No magic multipliers. No hysteria to sell...
OK, predictions.......................

PhysOrg.com) -- Over the past several years, researchers have built a variety of computer simulations created to predict Earth’s climate in the future. Most recently, most models have suggested that over the next fifty years, we’ll see an average worldwide rise in temperature of perhaps 1°C. Now a new group of simulations, using the combined computing power of thousands of personal computers, says that number is too low, and that we might see temperatures rise as much as 3°C, which would of course, be a far more serious situation. The simulations, run by climateprediction.net in conjunction with the BBC Climate Change Experiment, resulted in predictions of a rise in temperature ranging from 1.4°C to 3.0°C by 2050. The large team involved in the project has published their findings in Nature Geoscience.

Read more at: New simulation predicts higher average Earth temperatures by 2050 than other models

Wow GoldiRocks -- 1.4 to 3.0degC by 2050. That's worrisome ain't it? That's 2.2 +/ 0.8.. But then again, it's probably just as likely to be calling for 1.4 and missing that estimate by 50% on the high side....

Whatever should we do?

From the Phys.org article.

Once data was received from all the simulations, the researchers discarded those findings that didn’t make sense in a contextual sense. Of those remaining, none showed an increase of less than 1°C over temperatures from just a decade ago, while nearly 15% of them showed a rise of as much as 3°C by the year 2050.

While this new simulation isn’t definitive proof that temperatures worldwide will increase as much as predicted over the next thirty eight years, it most definitely is a warning that we as a species would be putting ourselves in peril if we don’t find a way to stop pumping carbon emissions into the atmosphere sooner rather than later.

"discarded" if it "didn't make sense" eh? Cute. Don't look there. 15% chance of 3degC? How MUCH garbage needed to be "discarded" and why? And why does Phys.org feel it needs to get all hysterical about PERIL before they answer those questions?
 
Looks like a pretty unequivical prediction that has been spot on. Perhaps you should try reading some of what the real scientists have written instead of the political shit of the rightwing of the GOP.
There is plenty of information, websites, links, & rebuttals that refute your quote. We are back to an argument by assertion, with no real evidence being submitted.
I can easily say the exact same thing about your 'political shit of the leftwing of the democratic party'.. but how is that an argument? It is a deflection.. a smear when you cannot answer someone's argument.
Assertation? Perhaps you have information that the Northwest Passage has not opened a couple of times already? Or that the West Antarctic Ice sheet is not in the process of breaking up? Or are you just flapping yap because you are too lazy to do the real research?
 

Forum List

Back
Top