Sunsettommy
Diamond Member
- Mar 19, 2018
- 14,917
- 12,544
- 2,400
C3 Headlines
September 1, 2021
Excerpt:
As earlier posts (post#1, post#2, post#3) have documented, recent global warming - aka climate change - has been rather uneventful, especially in the context of the last 6-7 years. But how does climate warming in the modern era with its high CO2 emissions compare to earlier periods of the 20th century during a low CO2 emissions era?
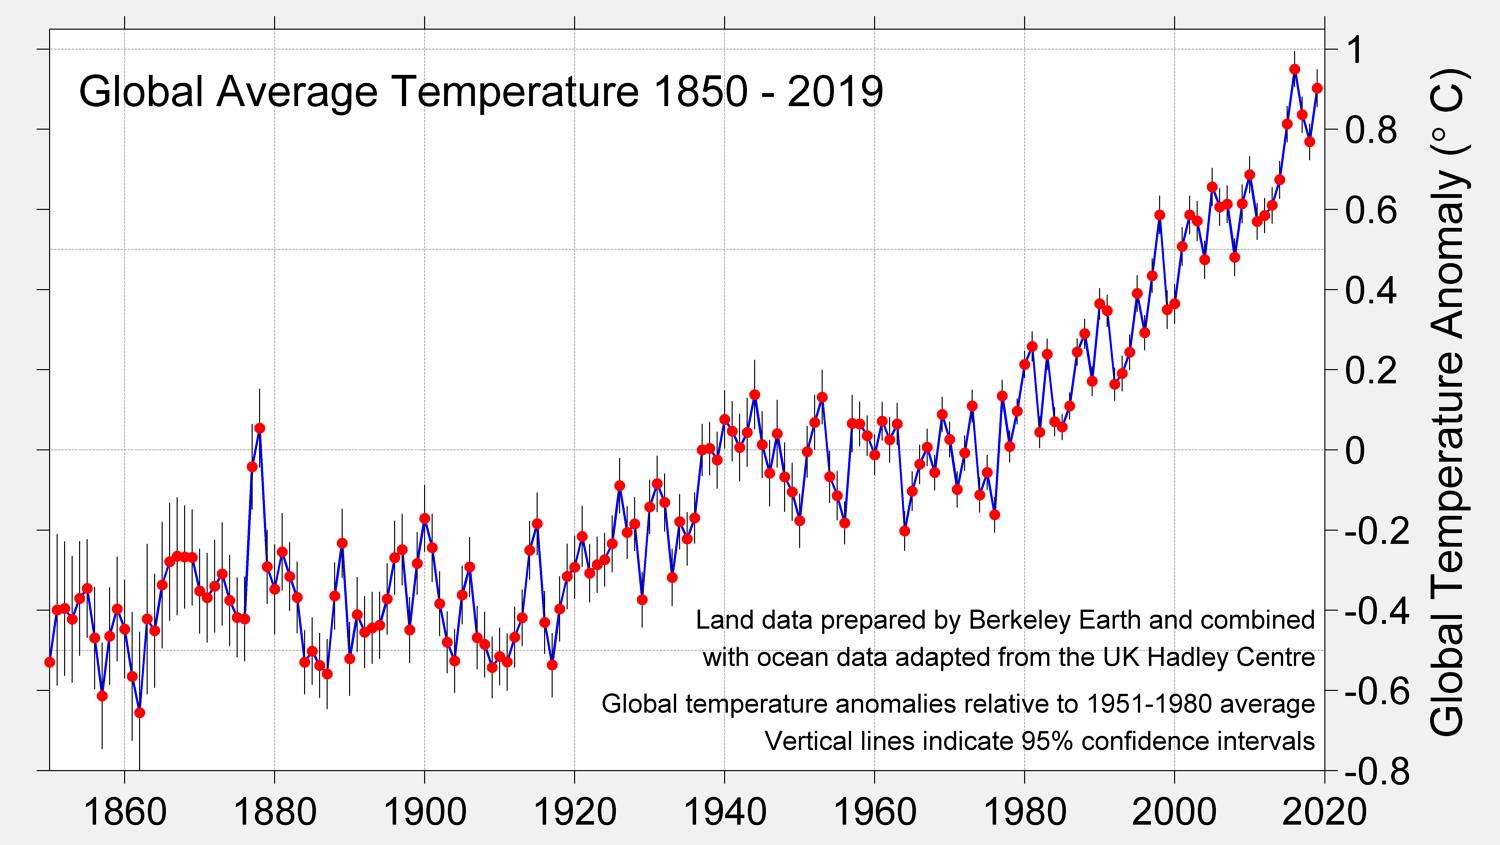
Using the same HadCRUT global temperature dataset as used in post #3, we compare the actual temperature change differences over multiple periods for the 20.5 year span ending June 31, 2021 versus the 20.5 year ending June 31, 1931.
This first chart has rolling 12-Month (1yr) temperature changes on the left, comparing those changes for for the span of time from January 1910 through June 1931 versus they same span length for the January 2000 through June 2021 span; and, on the right is a column chart of total cumulative growth of CO2 (ppm) in the atmosphere during those respective spans of calendar time.
The correlation between the temperature change and the CO2 ppm growth is shown on the CO2 chart. Both correlations are negative, strongly indicating that CO2 growth has no impact on short-term temperatures.
LINK
=====
Charts are in the link
More Empirical Evidence That Recent Climate Change Warming Is Not A Threat
September 1, 2021
Excerpt:
As earlier posts (post#1, post#2, post#3) have documented, recent global warming - aka climate change - has been rather uneventful, especially in the context of the last 6-7 years. But how does climate warming in the modern era with its high CO2 emissions compare to earlier periods of the 20th century during a low CO2 emissions era?
Using the same HadCRUT global temperature dataset as used in post #3, we compare the actual temperature change differences over multiple periods for the 20.5 year span ending June 31, 2021 versus the 20.5 year ending June 31, 1931.
This first chart has rolling 12-Month (1yr) temperature changes on the left, comparing those changes for for the span of time from January 1910 through June 1931 versus they same span length for the January 2000 through June 2021 span; and, on the right is a column chart of total cumulative growth of CO2 (ppm) in the atmosphere during those respective spans of calendar time.
The correlation between the temperature change and the CO2 ppm growth is shown on the CO2 chart. Both correlations are negative, strongly indicating that CO2 growth has no impact on short-term temperatures.
LINK
=====
Charts are in the link