Ding's big fails here.
1. CO2 is not the only driver of climate.
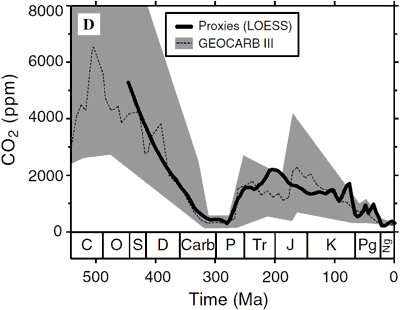
2. Cherrypicking. He uses a single study from 2000, and ignores all other studies. For example, Royer (2006), which summarizes many proxies, shows no sign of the spike he raves about.
http://droyer.web.wesleyan.edu/PhanCO2(GCA).pdf
]
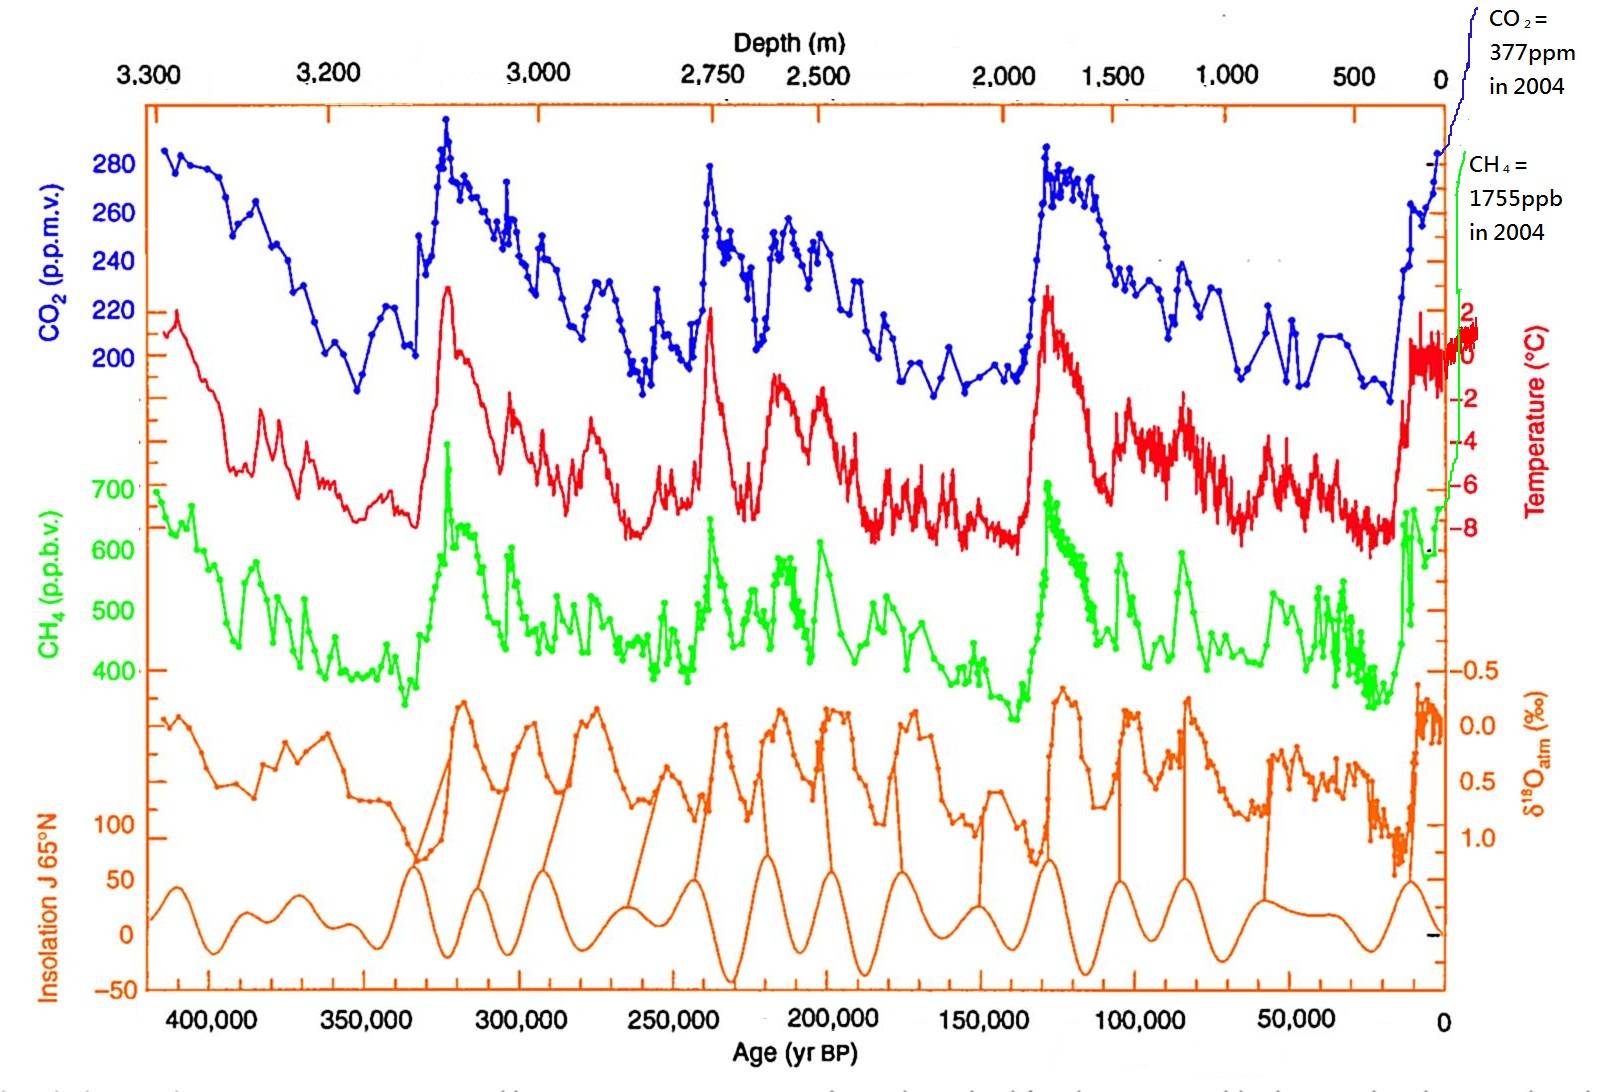
3. Bad use of graphs, his hallmark. He's comparing two graphs that may not even be related.
4. Assuming CO2 drove temp, and not the reverse.
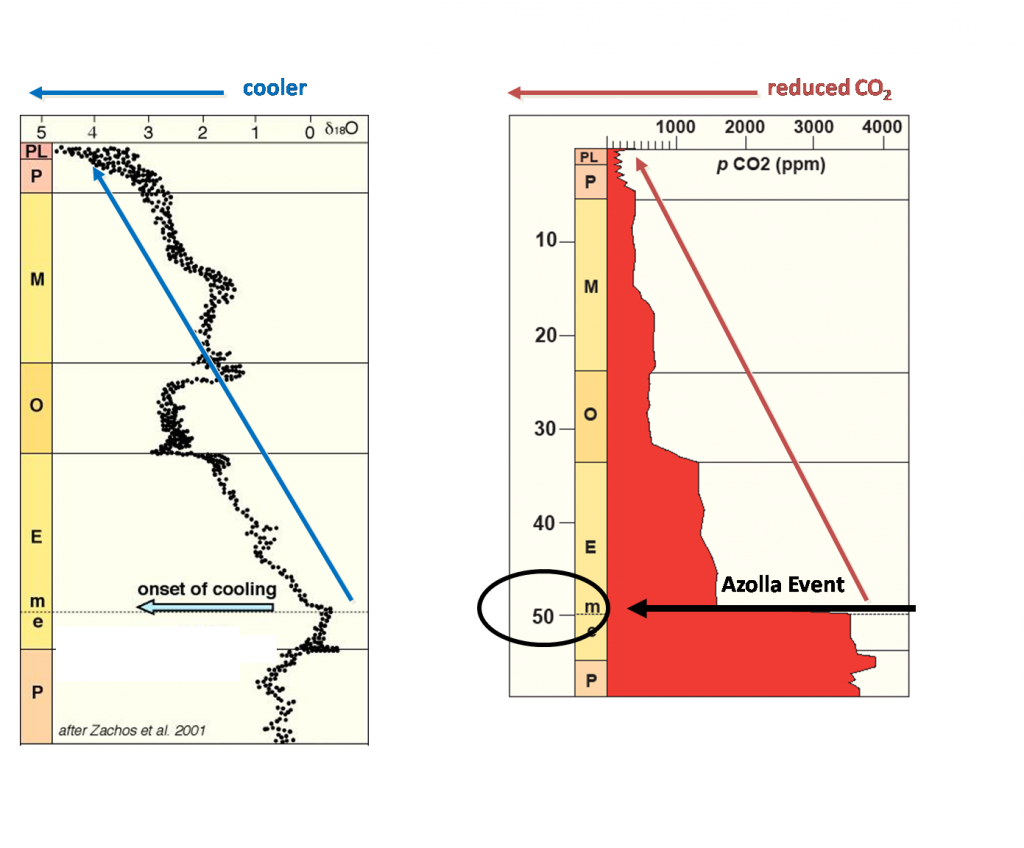
5. Failure to attribute sources. His graph on the right says it comes from Pearson and Palmer 2000, but that paper has nothing like it in it.
https://pdfs.semanticscholar.org/8714/d901415d8e2b860e21f40aace3f50c8fc1be.pdf
That is, even his representation of his cherrypick might be fraudulent. After all, Ding just copied it from a blog, and did no independent checking of it. Ding, what denier blog did you copy the graph from?
(Ding, of course, will not address any of this. Instead, he'll evade by reposting the same nonsense over and over.)
Ding, where did that "Pearson & Palmer 2000" graph come from? You owe everyone here that information.