- Thread starter
- #21
We are in an interglacial cycle, Crick. Our present temperature is at least 1.4C to 2.4C below the peak temperature of three of the last four interglacials.Then what do you believe is driving the current temperature change?
Follow along with the video below to see how to install our site as a web app on your home screen.

Note: This feature currently requires accessing the site using the built-in Safari browser.
We are in an interglacial cycle, Crick. Our present temperature is at least 1.4C to 2.4C below the peak temperature of three of the last four interglacials.Then what do you believe is driving the current temperature change?
Then what do you believe is driving the current temperature change?
Your reply reminded me of this.Then what do you believe is driving the current temperature change?
Nature.
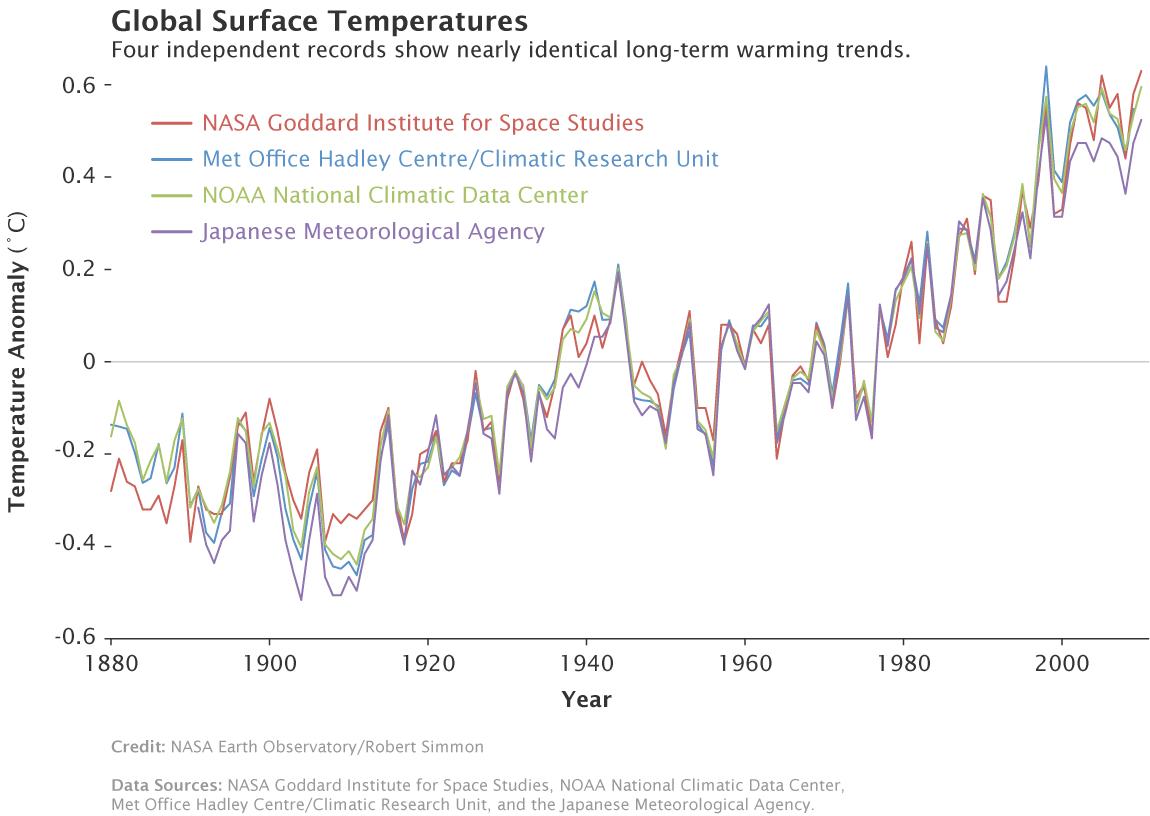
My goodness, you lying fool. That graph is from a NASA article that says exactly the opposite to what you are saying.We are in an interglacial cycle, Crick. Our present temperature is at least 1.4C to 2.4C below the peak temperature of three of the last four interglacials.Then what do you believe is driving the current temperature change?
View attachment 102550


Some dumbasses like yourself make a big deal out of the rate at which temperature is rising relative to the rate it rose during the previous interglacial cycles. My answer to that is that it is not possible to make that comparison because we have many data points for the last 50 years but very few for the previous interglacial cycles.My goodness, you lying fool. That graph is from a NASA article that says exactly the opposite to what you are saying.We are in an interglacial cycle, Crick. Our present temperature is at least 1.4C to 2.4C below the peak temperature of three of the last four interglacials.Then what do you believe is driving the current temperature change?
View attachment 102550
Global Warming : Feature Articles
How is Today’s Warming Different from the Past?
Earth has experienced climate change in the past without help from humanity. We know about past climates because of evidence left in tree rings, layers of ice in glaciers, ocean sediments, coral reefs, and layers of sedimentary rocks. For example, bubbles of air in glacial ice trap tiny samples of Earth’s atmosphere, giving scientists a history of greenhouse gases that stretches back more than 800,000 years. The chemical make-up of the ice provides clues to the average global temperature.
See the Earth Observatory’s series Paleoclimatology for details about how scientists study past climates.
Glacial ice and air bubbles trapped in it (top) preserve an 800,000-year record of temperature & carbon dioxide. Earth has cycled between ice ages (low points, large negative anomalies) and warm interglacials (peaks). (Photograph courtesy National Snow & Ice Data Center. NASA graph by Robert Simmon, based on data from Jouzel et al., 2007.)
Using this ancient evidence, scientists have built a record of Earth’s past climates, or “paleoclimates.” The paleoclimate record combined with global models shows past ice ages as well as periods even warmer than today. But the paleoclimate record also reveals that the current climatic warming is occurring much more rapidly than past warming events.
As the Earth moved out of ice ages over the past million years, the global temperature rose a total of 4 to 7 degrees Celsius over about 5,000 years. In the past century alone, the temperature has climbed 0.7 degrees Celsius, roughly ten times faster than the average rate of ice-age-recovery warming.
Temperature histories from paleoclimate data (green line) compared to the history based on modern instruments (blue line) suggest that global temperature is warmer now than it has been in the past 1,000 years, and possibly longer. (Graph adapted from Mann et al., 2008.)
Models predict that Earth will warm between 2 and 6 degrees Celsius in the next century. When global warming has happened at various times in the past two million years, it has taken the planet about 5,000 years to warm 5 degrees. The predicted rate of warming for the next century is at least 20 times faster. This rate of change is extremely unusual.
Global
They are not assumptions. The data came from NASA. I have not made any assumptions at all.In other words, to support your wild ass suppositions, you are accusing them of fraudulent science. LOL
Did they conclude that our present temperature is at least 1.4C to 2.4C below the peak temperatures of three of the last four interglacials?Yes, the data came from NASA. And their conclusions from that data are totally different from yours. And you are still trying to tell us that the slopes in the graph represent the same values. LOL
How is Today’s Warming Different from the Past?
Earth has experienced climate change in the past without help from humanity. We know about past climates because of evidence left in tree rings, layers of ice in glaciers, ocean sediments, coral reefs, and layers of sedimentary rocks. For example, bubbles of air in glacial ice trap tiny samples of Earth’s atmosphere, giving scientists a history of greenhouse gases that stretches back more than 800,000 years. The chemical make-up of the ice provides clues to the average global temperature.
See the Earth Observatory’s series Paleoclimatology for details about how scientists study past climates.
Glacial ice and air bubbles trapped in it (top) preserve an 800,000-year record of temperature & carbon dioxide. Earth has cycled between ice ages (low points, large negative anomalies) and warm interglacials (peaks). (Photograph courtesy National Snow & Ice Data Center. NASA graph by Robert Simmon, based on data from Jouzel et al., 2007.)
Using this ancient evidence, scientists have built a record of Earth’s past climates, or “paleoclimates.” The paleoclimate record combined with global models shows past ice ages as well as periods even warmer than today. But the paleoclimate record also reveals that the current climatic warming is occurring much more rapidly than past warming events.
As the Earth moved out of ice ages over the past million years, the global temperature rose a total of 4 to 7 degrees Celsius over about 5,000 years. In the past century alone, the temperature has climbed 0.7 degrees Celsius, roughly ten times faster than the average rate of ice-age-recovery warming.
Temperature histories from paleoclimate data (green line) compared to the history based on modern instruments (blue line) suggest that global temperature is warmer now than it has been in the past 1,000 years, and possibly longer. (Graph adapted from Mann et al., 2008.)
Models predict that Earth will warm between 2 and 6 degrees Celsius in the next century. When global warming has happened at various times in the past two million years, it has taken the planet about 5,000 years to warm 5 degrees. The predicted rate of warming for the next century is at least 20 times faster. This rate of change is extremely unusual.
Global Warming : Feature Articles
Every time you try to lie with that graph, I will post the original source, and show that the real scientists that created that graph are saying exactly the opposite that you are. And you continue to create a lie by stating that this is a NASA graph, then lying about the conclusions that the scientists derive from that graph. And you do not post the link to the original article for that reason.
The only science in AGW is the dubious science of deception and concealment.Zooming out.... even more natural variations. Holy shit it is natural variations all the way down!

Absolutely, that was going to be my next move. Thanks for saving me the effort. We could do this at almost all positive slope changes along the overall declining trend before man introduced GHG into the system.The only science in AGW is the dubious science of deception and concealment.Zooming out.... even more natural variations. Holy shit it is natural variations all the way down!
You have to squint to see the extent of the uncertainty as it is traced out in pale yellow on a white background.
I took a screen shot and placed dots at the base of the last peak in the proxy reconstruction an connected that dot with the top of the same peak including the uncertainty.
Then I did the same thing in the instrumental section and connected the dots to compare the slopes of these lines.i.e. the rate of change. And this showed up:
Even though the scandal how the blue portion the instrumental section had been spliced with the reconstructed section has been exposed years ago they continue to use it as if nothing was wrong. Who cares, but to say that we now have an unprecedented rate of change based on data like that really takes the cake
Yes and you could do this with almost every anomaly trend they graphed and published with a NASA emblem on top. The range of uncertainty is as large, often larger than the numbers they base their trends for anomalies on. But that does not stop them to also fabricate a false precision "accurate" to within a fraction of a degree.Absolutely, that was going to be my next move. Thanks for saving me the effort. We could do this at almost all positive slope changes along the overall declining trend before man introduced GHG into the system.The only science in AGW is the dubious science of deception and concealment.Zooming out.... even more natural variations. Holy shit it is natural variations all the way down!
You have to squint to see the extent of the uncertainty as it is traced out in pale yellow on a white background.
I took a screen shot and placed dots at the base of the last peak in the proxy reconstruction an connected that dot with the top of the same peak including the uncertainty.
Then I did the same thing in the instrumental section and connected the dots to compare the slopes of these lines.i.e. the rate of change. And this showed up:
Even though the scandal how the blue portion the instrumental section had been spliced with the reconstructed section has been exposed years ago they continue to use it as if nothing was wrong. Who cares, but to say that we now have an unprecedented rate of change based on data like that really takes the cake
Then what do you believe is driving the current temperature change?