Gun control working!

Look no further than London, England, where civilian firearm ownership is de facto banned. Heck, their dear leader had good common sense to ban not only firearms, but sharp, pointy objects as well.

Sorry, you just can't argue the good results, right?

Through March of 2018:
  • The murder rate is up 44 percent over the last twelve months
  • Violent crime is up 33% over the preceding twelve months
  • Home robbery is also up, by a third
  • Rape is up 18 percent

Guess those 100lb English ladies are finding the notion of fighting off a 250lb rapist with their fists to be a bit of a sticky wicket???

But hey, but at least there's no gun or knife crime, right?
  • Knife crime up 21 percent
  • Shootings up 23 percent from the previous year
  • More

Hmm...

Well, we all know the only reason London sees this crime is because of all the lax gun laws in nearly Indiana...

Oh, wait. Crap. Never mind.
Hmms, so before last year England didn't have strict gun control? Your stats, which you didn't source btw all speak about an increase this year. How does that help your argument?

They added new laws, try to keep up.
Sure, what laws? How do they correlate to the statistics put up? How do they stack up against the rates in the US and why pick only the stats for a city and not for England? Oh and what's the source of these statistics. See one can prove anything by sufficiently cherry picking statistics, or for that matter lie about them by not sourcing.
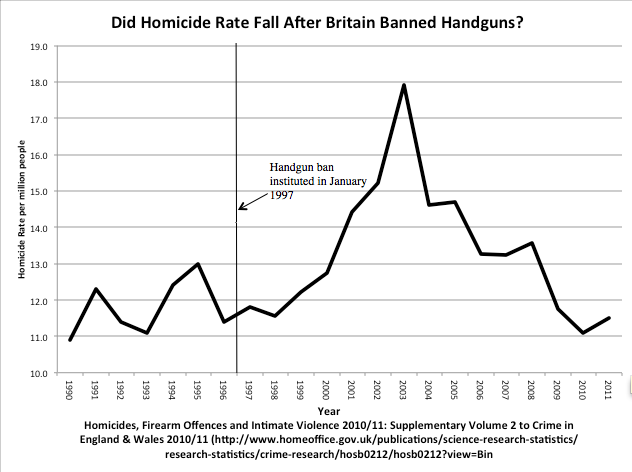
Likely you already knew the closest source fit appeared to be the Daily Fail. Despite the blaring headlines and bar charts they couldn't help admitting:
According to the crime survey, which the ONS says is the most reliable indicator of long-term trends in the most common types of offending experienced by the general population, there were an estimated 10.6 million incidents of crime, a fall of 7% on the previous 12 months.
Whenever crime slows to a crawl the media is going to blow a gasket the minute a new trend might be indicated. Any OP who withholds their source(s) is simply trolling anyway.
 
Look no further than London, England, where civilian firearm ownership is de facto banned. Heck, their dear leader had good common sense to ban not only firearms, but sharp, pointy objects as well.

Sorry, you just can't argue the good results, right?

Through March of 2018:
  • The murder rate is up 44 percent over the last twelve months
  • Violent crime is up 33% over the preceding twelve months
  • Home robbery is also up, by a third
  • Rape is up 18 percent

Guess those 100lb English ladies are finding the notion of fighting off a 250lb rapist with their fists to be a bit of a sticky wicket???

But hey, but at least there's no gun or knife crime, right?
  • Knife crime up 21 percent
  • Shootings up 23 percent from the previous year
  • More

Hmm...

Well, we all know the only reason London sees this crime is because of all the lax gun laws in nearly Indiana...

Oh, wait. Crap. Never mind.


Your analysis is disingenuous.

If there were 2 murders last year and there were 3 murders this year, it would be true to say that the murder rate increased by 50%.

It's the per capita rate that counts.

It's not at all disingenuous to show percentage changes following an action intended move the stats in a particular direction. Gov bans guns and shooting increase. That's worth a mention. But, to your point, per capita is important and in that regard, can you guess where America, with all our firearms, lands in the list of the top 100 countries by per capita murder rate? Hint: we don't. Last I checked we were number 126. The really interesting part is that the 125 countries with worse murder rates all have de facto bans on civilian firearm ownership. An ingenuous analysis of such facts leads me to conclude gun control is stupid. Bad people will always be here doing bad things. To restrict the ability of good guys to defend themselves against such evil is, well, stupid.
 
Oh, by the way,
I’m looking at the UK own damn numbers.
Where? Tell ya why I ask. 'Cause if you still think this sort of garbage:

Screen+Shot+2012-12-22+at++Saturday,+December+22,+9.26+PM.png

was created by www.homeoffice.gov.uk, think again. The link provided below the chart is dead, BUT the entire source indicated remains available >HERE<
Scroll the whole thing, I'll wait... Good, no such chart, right? Can you say FRAUD? I knew you could!
It looks like a section of the chart on page 17, except displayed as a rate (instead of a number), focusing on data from a shorter time period than is available in the official chart, and with an indicator line displayed to show the handgun ban. I've seen stuff like this before, like with a guy researching Detroit violent crime using old US government crime statistics books. Those books didn't have any charts (that I recall seeing, either way he made his own charts using the data), just tables of data. Hardly "fraud."

Found the data, it's on page 32. Looks like someone copied and pasted the data and made a chart out of it in excel. Feel free to spot check the data. I'm not seeing any "fraud."
 
Last edited:
It looks like a section of the chart on page 17, except displayed as a rate (instead of a number), focusing on data from a shorter time period than is available in the official chart, and with an indicator line displayed to show the handgun ban. I've seen stuff like this before, like with a guy researching Detroit violent crime using old US government crime statistics books. Those books didn't have any charts (that I recall seeing, either way he made his own charts using the data), just tables of data. Hardly "fraud."

Found the data, it's on page 32. Looks like someone copied and pasted the data and made a chart out of it in excel. Feel free to spot check the data. I'm not seeing any "fraud."
Fair enough and good detective work. "Fraud" could be hyperbolic depending on what definition you choose. "Hoax" applies for sure.
a plan to deceive someone, such as telling the police there is a bomb somewhere when there is not one, or a trick:

The bomb threat turned out to be a hoax.
He'd made a hoax call claiming to be the president.
Presented and credited to appear unbiased, scientific product of the British govt. Not so. Snuck in by an unusually talented, well funded, spinmeister / charlatan extraordinaire.
---------------------------------
"looks like a section of the chart on page 17" - Yep ( >LINK again< ). No wonder he doesn't use the actual chart. A three-year-old could easily tell from the long term trend that

a. The overall variation is slight.
b. The trend is gradual increase initially to a peak followed by gradual decline.

And if,.. if!... If one were to bother reading the surrounding text/description there,... Hwell then...
Just what the hell are you yammering on and on about? The extended chart, like the customized one, show that all the gun ban accomplished (even if the effect were from the gun ban), was a spike in offenses, which then went back to normal levels. The long-term trend is upward.

You've already been told the cause of violent crime: certain racial minorities. The USA has levels of blacks and latinos that various other European countries simply do not have.

American violence takes place in black inner cities for the most part. Just look at homicide rates: blacks commit 52% while being 13% of the population!

Then there are latinos. Central/South American countries are some of the most violent in the world and often by far. El Salvador has relatively few guns per person, but look at their ridiculous homicide rate. Oh BTW countries like that is where our immigrants tend to come from!
 
Thanks and yes, your sources being Murdoch tabloids on top of what has already been presented...
Red top tabloids, named after their distinguishing red mastheads, employ a form of writing known as tabloid journalism; this style emphasizes features such as sensational crime stories, astrology, gossip columns about the personal lives of celebrities and sports stars, and junk food news. Celebrity gossip columns which appear in red top tabloids and focus on their sexual practices, misuse of narcotics, and the private aspects of their lives often border on, and sometimes cross the line of defamation.

Red tops tend to be written with a simplistic, straightforward vocabulary and grammar; their layout, more often than not, gives greater prominence to the picture than to the word. The writing style of red top tabloids is, ofttimes, accused of sensationalism; in other words, red tops have been accused of deliberately igniting controversy and selectively reporting on attention-grabbing stories, or those with shock value. In the extreme case, red top tabloids have been accused of lying or misrepresenting the truth to increase circulation.
 
Just what the hell are you yammering on and on about? The extended chart, like the customized one, show that all the gun ban accomplished (even if the effect were from the gun ban), was a spike in offenses, which then went back to normal levels. The long-term trend is upward.

You've already been told the cause of violent crime: certain racial minorities. The USA has levels of blacks and latinos that various other European countries simply do not have.

American violence takes place in black inner cities for the most part. Just look at homicide rates: blacks commit 52% while being 13% of the population!

Then there are latinos. Central/South American countries are some of the most violent in the world and often by far. El Salvador has relatively few guns per person, but look at their ridiculous homicide rate. Oh BTW countries like that is where our immigrants tend to come from!
Haha! I really shouldn't laugh, but man! Remind me never to compliment you again. Teehee...
I don't see why you're so concerned with that particular chart anyway. You should just post your ignorant, zero-content reply like you did here.
 
At least one thing is certain.

LEFTISTS and ZIONISTS here do not like to be reminded of the truth of Hitler and gun control.....
 
Thanks and yes, your sources being Murdoch tabloids on top of what has already been presented...
Red top tabloids, named after their distinguishing red mastheads, employ a form of writing known as tabloid journalism; this style emphasizes features such as sensational crime stories, astrology, gossip columns about the personal lives of celebrities and sports stars, and junk food news. Celebrity gossip columns which appear in red top tabloids and focus on their sexual practices, misuse of narcotics, and the private aspects of their lives often border on, and sometimes cross the line of defamation.

Red tops tend to be written with a simplistic, straightforward vocabulary and grammar; their layout, more often than not, gives greater prominence to the picture than to the word. The writing style of red top tabloids is, ofttimes, accused of sensationalism; in other words, red tops have been accused of deliberately igniting controversy and selectively reporting on attention-grabbing stories, or those with shock value. In the extreme case, red top tabloids have been accused of lying or misrepresenting the truth to increase circulation.

What exactly is incorrect? If you can't state that with specificity, all you've done is present a logical fallacy. That you don't like the newspaper in which statistics appear is irrelevant.
Be happy. It's more content than I got out of his stupid ass.
 
I don't see why you're so concerned with that particular chart anyway.
Concerned with a particular chart now, am I? Let's review, shall we, sweet pea?
Oh, by the way,
I’m looking at the UK own damn numbers.
Where? Tell ya why I ask. 'Cause if you still think this sort of garbage:

Screen+Shot+2012-12-22+at++Saturday,+December+22,+9.26+PM.png

was created by www.homeoffice.gov.uk, think again. The link provided below the chart is dead, BUT the entire source indicated remains available >HERE<
Scroll the whole thing, I'll wait... Good, no such chart, right? Can you say FRAUD? I knew you could!
Notice sakinago finally posts a >LINK< to a website with long lost idiot John Stossel evident above and prominently advertising several books sporting extremely topic suggestive gun nuttery while having the nerve to claim being impartial, unaffiliated with the NRA, and unfunded by the Kochsuckers or similar Nazi propagandists in its "About" section. Sporting the chart in question as well, among others. It's the first one they show. The one I described as "this sort of garbage" in response to sakinago saying "I’m looking at the UK own damn numbers." That's why, slowpoke. It was just one example. In no way, just "that particular chart". sakinago wasn't "looking at the UK own damn numbers." Do try to keep up.

John Stossel <- nuff said right there. All intelligent life knows it's crap already!
No, I mean why did you bother trying to refute it by saying it's nowhere in that PDF? I thought you were content to use zero-content responses like "Haha! I really shouldn't laugh, but man!" This much effort is out of character for you.
 
What exactly is incorrect? If you can't state that with specificity, all you've done is present a logical fallacy. That you don't like the newspaper in which statistics appear is irrelevant.
Oh, I don't think you want to bore the readers with a review of the tons already presented. But, no worries, bgrouse can help you:

"It looks like a section of the chart on page 17, except displayed as a rate (instead of a number), focusing on data from a shorter time period than is available in the official chart, and with an indicator line displayed to show the handgun ban."

Got it? No? Alright, see it "looks like" the chart "except" it's clearly not. A section "displayed as a rate" that's actually displayed as simply the raw numbers in the genuine, original chart. See the numbers were so small Lott feared everyone would just laugh if he used those. He used the per million data to dazzle everyone with the govt's own pointless "rate" BS so none would now notice the loss of a zero value x-axis. The time frame, not simply "shorter", two thirds chopped off. The mild variations then stretched vertically to appear significant. Yes, (some of) the same data, but corrupted in its presentation to tell a different tale. A bogus one.

Once more, >Here< is the original. Now read the section "1.3 OFFENCES RECORDED AS HOMICIDE" - the expert description beginning on page 16 and surrounding the chart on page 17. Also, don't fail to notice how the exact opposite of your and Mr. Lott's want is what they conclude from the data.
 
What exactly is incorrect? If you can't state that with specificity, all you've done is present a logical fallacy. That you don't like the newspaper in which statistics appear is irrelevant.
Oh, I don't think you want to bore the readers with a review of the tons already presented. But, no worries, bgrouse can help you:

"It looks like a section of the chart on page 17, except displayed as a rate (instead of a number), focusing on data from a shorter time period than is available in the official chart, and with an indicator line displayed to show the handgun ban."

Got it? No? Alright, see it "looks like" the chart "except" it's clearly not. A section "displayed as a rate" that's actually displayed as simply the raw numbers in the genuine, original chart.
I'm not exactly sure what you're saying, but whoever made the chart appears to have used the first (Year) and fifth (Offenses currently recorded as homicide per million population) columns of the data table as the source data, so I don't see anything underhanded.
 
You can lead a horse to water so many times and that's it. One can't pound it in to them.
 
Last edited:

Forum List

Back
Top