You are still mixing proxy data, which is very unreliable, with direct satellite measurements which only cover about 30 years to show a cooling cycle that never happened over the last 100 years. You have warm cycles followed by FLAT cycles, but no cooling cycles for nearly 100 years.Ummm, the data is from multiple sources to whit..Great, you supply a chart that combines proxy data, from the southern hemisphere only, with direct global satellite measurements, something deniers denounced Michael Mann for doing with his hockey stick graph. But even your graph shows a steady warming trend over the 100 years with no sustained cooling trend at all, only year to year fluctuations.
Try again.
2000-1979: Satellite stratospheric data
1979-1871: S. Hemisphere ground temp. data
1871- 422k B.P.: Vostok Ice Core Data
Mann derived his graph from a SINGLE tree. From within a grove where ALL OTHER TREES showed a different result. But hey, don't let a little thing like facts get in your way.
Here is a chart that has all ground station direct instrument measurements throughout:
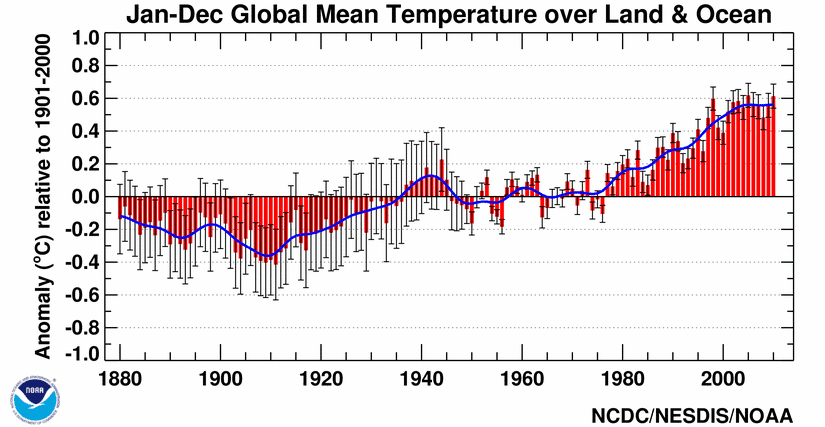
Yes, that graph has all of Hansons "corrections" in it. Funny how when you use foreign temp records they don't show the same thing. I hate to tell you but ANYTHING he has touched is tainted and unusable.