Global Warming 'Splained

Is there an experiment that builds in the varying other components of the Climate system along with the effects of CO2? I'm guessing that the recent eruption of the volcano in Iceland will produce a drop in temperature readings in that area of the world in the near term and and an increase in the albedo in the months to come as the ash settles.

Cloud cover as a result of increased water vapor?

Too many variables in the real world for the gas in a bottle you describe.

There are sophisticated modellings and they are produced and refined on a regular basis each new model and refinement includes the additions of new understandings and new considerations
.
The Iceland volcano did not produce any significant regional or global cooling, due to both the nature of its emissions and the manner of its eruption (Low sulfur, and more of a "belching" than the Strato-volcanic blasts that send much of their gas and dust into the upper stratosphere.


Predicting the Future with Climate Models - Models Predict the Future

Hotter or not? Should we believe model predictions of future climate change? - http://www.iac.ethz.ch/people/knuttir/papers/knutti08significance.pdf

Iceland's volcanic eruption will not affect climate patterns - Iceland's volcanic eruption will not affect climate patterns | Homeland Security News Wire
 
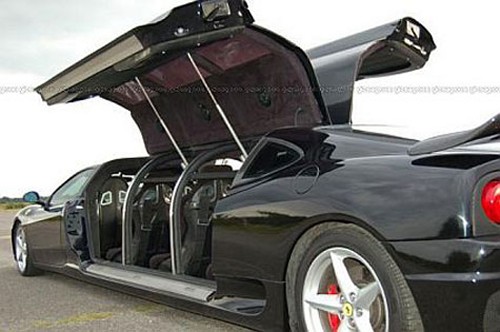
A vast majority of real American males do not want to be caught dead driving one of these gay vehicles that Rocks and Thunder tool around in..................

35388588.jpg
ferrari-360-modena-stretched-limo.jpg

Urban Dictionary: penis car
penis car

Any flashy, expensive, and/or fast car that a man uses to make up for his small cock. Penis cars can also have big rims, big sound systems, expensive interier, and so on. Ferraris, Bugattis, Corvettes, Porsches, Dodge Vipers, Lamborghinis and Hummers are all penis cars. If you have a penis car, you should trade it in for a mid-size truck, but not a huge on as huge trucks are also penis cars. owners of penis cars are usually caught wearing tight jeans, white cowboy hats and American flag button down shirts.

1.1291330424.big-car.jpg
 
Last edited:
You are reading the instrument record of the current times vs the proxy temps of the past. Comparing a progression of climate measured by one method and then switching at any point to different data collection technique invites error. The proxy temps of current show that the temperature now is lower than in the past.

It is certainly the case that if one is using one method and then aburptly switches to another method, that extreme care must be employed to insure the integrity of the data and the projections made from such data. This simply isn't an issue with the graph in question which employs a multitude of proxies for pre-instrument data, and in fact does not quit using much of the proxy data during the transition to modern data representations, it merely overlays and highlights the instrument measurements because we are certain of their degree of precision and accuracy. Now it is rare that proxy information is used for the most modern data points (those of the last 50 years or so), primarily because we have much greater coverage and precision with the instrument data. This said, climate science isn't resting on past accomplishments and is continually looking for new pre-instrument proxies and testing and refining the reliability and accuracies of all proxy measurements and benchmarking them against the instrument standards.
I am certainly no expert on the broad spectrum of proxies, but I am familiar with the overall procedures and processes, so if there is any specific and particular proxy issues that you would care to discuss in more detail I would be happy to share my understandings and provide references for my understandings where possible.

Anecdotal evidence supports this as glaciers that are receeding now are receeding to points that they were at many thousands of years ago.

If the receeding glaciers of today are put forth to prove warming, then the proof that they advanced from points we are now at at a point in the past has to be, by the same logic, that the climate at that time was dropping and has remained low until now.

If that is the case, and it is, then this is far from being an Anthropogenically induced departure from the normal state of things. If anything, this would show that we are simply riding the global and natural cycle of climate variation.

Ötzi the Iceman - Wikipedia, the free encyclopedia

The global average records are what they are, but there are issues that many forget about when looking at issues like Otzi. It must be understood that regional warmings and coolings happen despite global trends and events. Issues like the Medieval Optimum and the LIA clearly demonstrate that regional and even hemispheric anomalies occassionaly buck the global trends causing some areas to experience decades or even centuries worth of cooling or warming, while the overall planetary trend is different.

And of course, regardless of records of the past. We understand and can demonstrate the atmospheric "greenhouse effect," we can measure the precise levels of GHGs in the atmosphere, and we can compellingly demonstrate with multiple lines of evidence precisely where those gases are coming from. So even if we throw out ever bit of mountain range of evidences prior to 1800. We can still compellingly support and demonstrate the scientific basis of AGW, its causes, its ultimate results and the needed actions to remediate the worst of its potential impacts.
 
Yes, it will matter. A bit more warming will do wonders for improving the quality of human life just like it did during the Medieval Warming Period. The mini Ice Age ended in the mid 1880s, and the warming ever since has been very favorable to agriculture.

If all AGW was going to do, is bump the global temps up like the regional hemispheric bump Europe and the N. Atlantic region experienced in the MWP, I'd agree with you. Unfortunately, we have already more than doubled the warming experienced in the MWP and this is globally not regionally, and it is just the start of the warming not the end of it.

trakar-albums-agw-picture3532-temperature-pattern-mwp.gif
)

vs.

trakar-albums-agw-picture3533-temp-pattern-1999-2008-noaa.jpg
)

And this is just the start, even if we could cease all open-cycle combustion of fossil fuels today, it would take a century or more before the planet equilibrates to the additional CO2 we have already added to the atmosphere, and several millenia before temperatures begin to decrease to where they would have been without mankind's atmospheric dumping. So far we seem to be stuck at (or near) the top end of (Business As Usual) which means not just continued emissions, but continued accelerating emission rates. If this continues unabated we could easily see a tripling of preindustrial atmospheric CO2 levels within the next 6-10 decades and an initiating of planetary conditions that will, over a few centuries, come more to resemble those of the PETM, rather than anything that has existed on this planet in the history of our species.

All of this sounds very scientific and logical.
That is because it is very scientific and logical. The reason that you are unable to appreciate that fact is because you're an anti-science, illogical, bamboozled, confused, ignorant, and apparently rather stupid dupe of the fossil fuel industry and their propaganda campaign to deny anthropogenic global warming/climate changes, prevent any effective governmental action to restrict carbon emissions and thus preserve their trillion dollar a year profit stream that flows from the sales of carbon emitting fossil fuels.


However, the current warming period that we are enjoying and which followed the Little Ice Age started before the Industrial Revolution. That is, it started before the vast burning of Fossil Fuels. It has continued with some ups and downs at a pretty consistant rate in spite of increasing CO2 levels.
That's a good sample of the kind of misinformation and lies that you've swallowed. Global average temperatures were fairly stable for the last six thousand years and only varied by about a half a degree centigrade up or down over that period. The current abrupt warming began about the time of the Industrial Revolution and the rate of warming has itself increased, almost doubling in the last 50 years.

Is the climate warming?
National Oceanic and Atmospheric Administration - National Climatic Data Center
Global surface temperatures have increased about 0.74°C (plus or minus 0.18°C) since the late-19th century, and the linear trend for the past 50 years of 0.13°C (plus or minus 0.03°C) per decade is nearly twice that for the past 100 years.


The rate of increase in Global temperature from the year 0 to the year 1000 was greater than the increase from the year 1001 to the year 2000.
Another bit of misinformation that has no support in the scientific literature.

Sorry deniers, hockey stick gets longer, stronger: Earth hotter now than in past 2,000 years
(excerpts)

A new peer-reviewed study by climatologists and earth scientists Michael Mann, Zhihua Zhang, Malcolm Hughes, Raymond Bradley, Sonya Miller, Scott Rutherford, and Fenbiao Ni now extends the reconstruction back nearly 2000 years:

mann1.jpg


Here is link to the Proceedings of the National Academy of Sciences study, “Proxy-based reconstructions of hemispheric and global surface temperature variations over the past two millennia.” The Supplemental Material is here (warning, big PDF). I have also taken some of the PDF figures and turn them into JPEGs. For the first ever, I believe, the authors did a multi-proxy reconstruction of the Southern Hemisphere for the past 1500 years (see figure at end).

A key advance of the new work is that it derives historical temperature through multiple, overlapping proxy records, including “the growth patterns of trees and coral, the contents of ice cores and sediments, and temperature fluctuations in boreholes.” Proxies are used because modern scientific instruments were available for only a small and recent part of Earth’s climatic history.


What are the paper’s main conclusions?

Following the suggestions of a recent National Research Council report [NRC (National Research Council) (2006) Surface Temperature Reconstructions for the Last 2,000 Years (Natl Acad Press, Washington, DC).], we reconstruct surface temperature at hemispheric and global scale for much of the last 2,000 years using a greatly expanded set of proxy data for decadal-to-centennial climate changes, recently updated instrumental data, and complementary methods that have been thoroughly tested and validated with model simulation experiments. Our results extend previous conclusions that recent Northern Hemisphere surface temperature increases are likely anomalous in a long-term context. Recent warmth appears anomalous for at least the past 1,300 years whether or not tree-ring data are used. If tree-ring data are used, the conclusion can be extended to at least the past 1,700 years, but with additional strong caveats. The reconstructed amplitude of change over past centuries is greater than hitherto reported, with somewhat greater Medieval warmth in the Northern Hemisphere, albeit still not reaching recent levels.​

The bottom line from Mann:

"You can go back nearly 2,000 years and the conclusion still holds–the current warmth is anomalous. The burst of warming over the past one to two decades takes us out of the envelope of natural variability."​


Climate can and has changed without any input from man's burning of Fossil fuels.
That's true but so what? That fact does not mean that the climate isn't changing now because of mankind's burning of fossil fuels. Your argument makes about as much sense as saying that because forest fires happened naturally in the past, then mankind's actions can't possibly be responsible for any now.


The Scenarios and the resulting predictions put forth by Dr. James Hansen in 1988 were based on the theories that you promote above and were wrong.
Wow, codlicker, you manage to be wrong about just about everything. But that's what you get for keeping your head shoved so far up Rush Limpdick's ass.

Climate Models
(excerpts)

Climate Models and the Past

Dr. James E. Hansen used current theories based on greenhouse gases, changes in solar, volcanic, ozone, land use and aerosol concentrations to create temperature reconstruction of the last 130 years. Hansen's model is shown below as the black line. The blue line with stars is the actual temperature data we have. As you can see the model reflects the observed temperature data very well. This is very strong proof that the models do in fact work. What is especially striking is the fact that the models "are not statistical, but are physical in nature." Statistical models use training data to find correlations. For example a batting average in baseball is based off of ones batting history. This can be used as a statistical model to predict the future. A physical model of a player at bat would likely use equations based on the velocity of the baseball, force of the swing, etc and ignore the players batting history. The climate models used by the IPCC and NASA are not statistical models. NASA's climate models make their predictions based off of the laws of physics. Since the models are based off of physics comparing them to the past is almost as good as testing them with predictions of the future. Another advantage of physical models over statistical models is best described by physicist Ulf Bossel: "the laws of physics are eternal and cannot be changed with additional research, venture capital or majority votes." There may be gaps in our knowledge but once a mechanism is understood the physics used to describe that mechanism is not going to change.

figure1_hansen05s-m.jpg

Fig 1. Source: Hansen et al. 2005 doi:10.1126/science.1110252.

Past Attempts of Climate Models to Predict the Future

On June 23, 1988 James Hansen testified in front of congress on global warming. Hansen said he could state "with 99% confidence" that a long-term warming trend was underway, and he strongly suspected that the greenhouse effect was to blame. He provided the following graph as part of his Congressional testimony on global warming. (Figure 2) So fast forwarding 20 years later Hansen releases an updated version of his graph in the proceedings of the National Academy of Sciences "Global temperature change". (Figure 3) Again his models are very accurate.

Hansen's Original 1988 Graph of Predictions
hansenfig3a.png

Fig 2. Hansen and Lebedeff, 1988

Hansen's 2006 Graph Confirming 1988 Predictions
Hansen-2006.png

Fig 3. Source: PNAS, Hansen et al. 103 (39): 14288. (2006)

Other Climactic Behaviors and Mechanisms Correctly Predicted & Reconstructed by the Models

Most notable is that the models have not only correctly predicted temperature trends but they've predicted how the earth will change. The following is a list of successful predictions made by the models:

Models predict that surface warming should be accompanied by cooling of the stratosphere, and this has indeed been observed;

Models have long predicted warming of the lower, mid, and upper troposphere. For a while satellite readings seemed to disagree but it turns out the satellite analysis was full of errors due to changing orbit (gravity pulling on satellite), sensor issues, etc and on correction, this warming has been observed;
Mears et al, Santer et al and Sherwood et al show that the discrepancy has been mostly resolved, in favor of the models.

Models predict warming of ocean surface waters, as is now observed.

Models have successfully reconstructed ocean heat content. (Fig 6)

Models predict an energy imbalance between incoming sunlight and outgoing infrared radiation, which has been detected;

Models predict sharp and short-lived cooling of a few tenths of a degree in the event of large volcanic eruptions, and Mount Pinatubo confirmed this; (Figure 7)

Models predict an amplification of warming trends in the Arctic region, and this is indeed happening; (Figure 8)

Models predict continuing and accelerating warming of the surface, and as you can see from figures 2 & 3, they have had a very good track record.


***
 
THIS is a penis car...............a BIG ASS PENIS CAR......................

[ame=http://www.youtube.com/watch?v=lYIZ9tCTloo&feature=player_embedded]YouTube - ‪2003 Ford Mustang Cobra Burnout‬‏[/ame]

a must have once in your life. ( not intended to be driven by limpwristers)
 
Find me a little gay SMARTCAR on the road and I'll show you a smug, feminine male driving it who is involved in scores of "causes" in their lives. These are the people who got picked last for the team and nobody gave a shit whether or not they came to the party or not. For them, a meaningful interaction with a woman was them saying, "What size bra do you wear?"........and now, all growed up..........they must make a statement to get attention...."Im part of a 'cause'."

Human behavior is very predictable.........and much more than people realize.


Seriously..........would ANYBODY be shocked to find out this is a pic of Rolling Thunder or Rockls???


9590ba87.jpg
 
Last edited:
THIS is a penis car...............a BIG ASS PENIS CAR......................

YouTube - ‪2003 Ford Mustang Cobra Burnout‬‏

a must have once in your life. ( not intended to be driven by limpwristers)

Really? Why? I helped build a 396 Chevelle that would shut down that lead sled. And that was 40 years ago. Now here is a fast car.

Welcome to Plasma Boy Racing, home of White Zombie, the world's quickest street legal electric door slammer in the 1/4 mile drag.


LMAO.......again.

High 11's???:lmao::rofl:

We build Fox Body Mustangs that run in the 11's for less than $10,000. That Cobra in the video above runs in the 9's with slicks. And that pos electric car has a top speed of 129mph.......not TOOOOOOOOOOO fcuking funny.


396 Chevelle vs TT Cobra Terminator. LMBO.......no 396 Chevelle is running low 10's without a 200 shot of nitrous. But oh.......let me guess...........40 years ago, that 396 was running spray??!!!:up::fu:


Rocks.......you are such a fcukking fraud and you know it.:lol:
 
...
We build Fox Body Mustangs that run in the 11's for less than $10,000. That Cobra in the video above runs in the 9's with slicks. And that pos electric car has a top speed of 129mph.......not TOOOOOOOOOOO fcuking funny.


396 Chevelle vs TT Cobra Terminator. LMBO.......no 396 Chevelle is running low 10's without a 200 shot of nitrous. But oh.......let me guess...........40 years ago, that 396 was running spray??!!!:

Actually, nitrous was fairly common back in the mid-late 70s (which was pretty close to 40 years ago). The injection methods were generally pretty crude, but like manual cutouts that would allow you to temporarily slide your exhaust travellers down, clearing your headers bypassing the mufflers giving you straight pipes,...it worked good enough. Combine this with a good piece of Detroit big block iron like a 440 or 455 both of which had plenty of cylinder thickness to overbore, a good 3/4" racing cam package and if you managed to save up some money a nice low profile, Paxton blower, and a Hurst planetary tranny to send all that power to the wheels and low 10s would never push you over $5K unless you were paying someone to do it for you. Of course, I'm sure inflation pushes that up into the same range you are talking about. I just wish we had modern rubber back then. The difference in tires over the last 40 years is tremendous!! Ah, the days when gas was 37cents a gallon, Camel straights were 40cents a pack and the only reason you wore a raincoat was to keep from having to get married,...but times and considerations change, and we either grow with them or we get left in the past.

None of this means that you can't go fast greenly, the torque and top end in electric motors far outstrips any ICE, the only problem currently is in getting an energy storage system that can compete with the chemical energy storage of gasoline, and its getting there, but its not there yet.
 
Is this one acceptable?
harley-sportster-883-custom-4.jpg

Completely, though personally, if we're looking at the new ones, I'd prefer the Fatboy lo or the Rocker - C, but that's just me, I was always more partial to the soft tails than the sportsters. So what do you get in mileage 40-50mpg? definitely better than most cages.
 

Forum List

Back
Top