Global warming over the last 16 years

While we are discussing tenths of a degree on global scale, very important tenths, on a local scale, those tenths get magnified.

U.S. records warmest March; more than 15,000 warm temperature records broken

Apr. 10, 2012 — Record and near-record breaking temperatures dominated the eastern two-thirds of the United States and contributed to the warmest March on record for the contiguous United States, a record that dates back to 1895. More than 15,000 warm temperature records were broken during the month.

The average temperature of 51.1°F was 8.6 degrees above the 20th century average for March and 0.5°F warmer than the previous warmest March in 1910. Of the more than 1,400 months (117+ years) that have passed since the U.S. climate record began, only one month, January 2006, has seen a larger departure from its average temperature than March 2012.

We are seeing this effect in Australia right now. And, because of the effect of the lack of Arctic Ice on the jet stream, we are seeing the cold weather in parts of the Northern Hemisphere, while the Arctic Ice freezeup remains well below historic levels.
 
oh.... and Old Rocks, if the temps are not going up then by definition they are not warming. and it is especially not accelerating warming.

If we are getting negative forcing from the solar TSI, and negative forcing from the La Nina, yet we are still seeing years that rank in the top ten of the warmest on record, then there is a definate increase from the heat retained by the GHGs. Otherwise, we would be seeing a cooling.

Watch what happens on the next El Nino.
 
OK, we hear a lot of flap-yap about it not having warmed in the last 16 years. So what is the truth of the matter?


Global warming over the last 16 years - YouTube

16 years is about as long as a blink of an eye when it comes to climatology. Whether or not it's gotten warmer during this time period is irrelevant. It does not represent a trend either way.

I suppose these numbers do not represent a trend either, correct?

http://arctic.atmos.uiuc.edu/cryosphere/IMAGES/seaice.area.arctic.png

Nor these?

UAH v5.5 Global Temperature Update for December, 2012: +0.20 deg. C « Roy Spencer, Ph. D.

How about these?

[ame=http://www.youtube.com/watch?v=EoOrtvYTKeE]NASA | Temperature Data: 1880-2011 - YouTube[/ame]
 
I laughed so hard when I saw this on DRUDGE today...............


It’s snowing, and it really feels like the start of a mini ice age
Something is up with our winter weather. Could it be the Sun is having a slow patch?

Now Piers has a very good record of forecasting the weather. He has been bang on about these cold winters. Like JMW Turner and the Aztecs he thinks we should be paying more attention to the Sun. According to Piers, global temperature depends not on concentrations of CO2 but on the mood of our celestial orb. Sometime too bright the eye of heaven shines, said Shakespeare, and often is his gold complexion dimmed. That is more or less right. There are times in astronomical history when the Sun has been churning out more stuff — protons and electrons and what have you — than at other times. When the Sun has plenty of sunspots, he bathes the Earth in abundant rays.

When the solar acne diminishes, it seems that the Earth gets colder. No one contests that when the planet palpably cooled from 1645 to 1715 — the Maunder minimum, which saw the freezing of the Thames — there was a diminution of solar activity. The same point is made about the so-called Dalton minimum, from 1790 to 1830. And it is the view of Piers Corbyn that we are now seeing exactly the same phenomenon today.

Lower solar activity means – broadly speaking – that there is less agitation of the warm currents of air from the tropical to the temperate zones, so that a place like Britain can expect to be colder and damper in summer, and colder and snowier in winter. “There is every indication that we are at the beginning of a mini ice age,” he says. “The general decline in solar activity is lower than Nasa’s lowest prediction of five years ago. That could be very bad news for our climate. We are in for a prolonged cold period. Indeed, we could have 30 years of general cooling.”

...............


It?s snowing, and it really feels like the start of a mini ice age - Telegraph
 
Last edited:
Ah, Drudge. That explains where Skook gets a lot of his retardation. Skook, was it Drudge who made you repeat the endless predictions of Romney's certain crushing landslide victory?

So, some right-wing numbnuts in England said he's cold, babbled some senseless BS ... and Skook believes that disproves AGW.

Now, a non-retarded person, before claiming low solar output caused it to snow in his backyard, would at least look at measurements of solar output. The fact that solar output is increasing now would most likely dissuade them from making such a claim. But these are denialist true believers. If he and Skook _feel_ solar output is declining, then it must be so.
 
OK, we hear a lot of flap-yap about it not having warmed in the last 16 years. So what is the truth of the matter?


Global warming over the last 16 years - YouTube


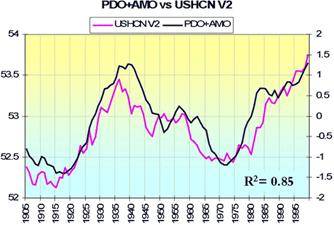
why just correct for ENSO? why not the PDO and AMO? personally I have a strong suspicion that it is probably incorrect to 'correct' for any of them except for volcanoes but here is a diagram showing the correlation for ocean current cycles

image050.jpg
From the chart, where they correlate it looks like US land temps LEAD the PDO+AMO by almost 5 years.

pdo_amo_ushcn.jpg
 
Last edited:
OK, we hear a lot of flap-yap about it not having warmed in the last 16 years. So what is the truth of the matter?


Global warming over the last 16 years - YouTube


why just correct for ENSO? why not the PDO and AMO? personally I have a strong suspicion that it is probably incorrect to 'correct' for any of them except for volcanoes but here is a diagram showing the correlation for ocean current cycles

image050.jpg
From the chart, where they correlate it looks like US land temps LEAD the PDO+AMO by almost 5 years.

pdo_amo_ushcn.jpg

interesting idea. but it actually looks like the ocean currents lead the increases and trail the decreases.

I dont think that it is likely to be good scientific practise to lump the two together anyways. I would like to see the effect of both ocean currents on their surrounding areas rather than combined vs global temp.
A perfect example of how deniers see only what they want to see.

Land temps start to rise around 1915 followed by the ocean current around 1920.
Land temps start to fall after 1936 and ocean currents follow around 1941.
Land temps start to rise around 1947 and ocean currents follow around 1952.
Ocean currents start to decline around 1957 and the land follows around 1959.
Ocean currents start to rise around 1961 and land continues to fall.
Ocean currents start to fall around 1926 and land continues to fall.
Land temps bottom in 1965 ocean currents in 1972.
Land temps start to rise around 1971 ocean currents around 1972.
Land temps start to fall after 1972 as ocean currents continue to rise.
Land temps start to rise in 1975 as ocean currents continue to rise.
Land temps fall after 1978 as ocean currents continue to rise.
Land temps start to rise after 1980 as ocean currents continue to rise.
Ocean temps start to fall after 1983 land after 1986.
Land starts to rise after 1988 ocean currents in 1990.

Most of the time land leads ocean currents up or down or is out of sync with ocean currents.
 
World land and ocean temps combined are even more out of sync with ocean currents when looked at separately.

What do you see?

We can agree what it does NOT look like: wider and wider swings with an overall increase.

It looks like a natural, cyclical fluxuztion
Again deniers see only what they want to see.

Actually, only both ocean currents show a natural cyclic fluctuation. The global land and ocean temps combined shows an overall increase. Some other forcing is overriding the natural cyclic forcings of the ocean currents effects on global temps.
 
Last edited:
World land and ocean temps combined are even more out of sync with ocean currents when looked at separately.

What do you see?

We can agree what it does NOT look like: wider and wider swings with an overall increase.

It looks like a natural, cyclical fluxuztion
Again deniers see only what they want to see.

Actually, only both ocean currents show a natural cyclic fluctuation. The global land and ocean temps combined shows an overall increase. Some other forcing is overriding the natural cyclic forcings of the ocean currents effects on global temps.

How can the land be increasing independently of the oceans?
Learn to read.

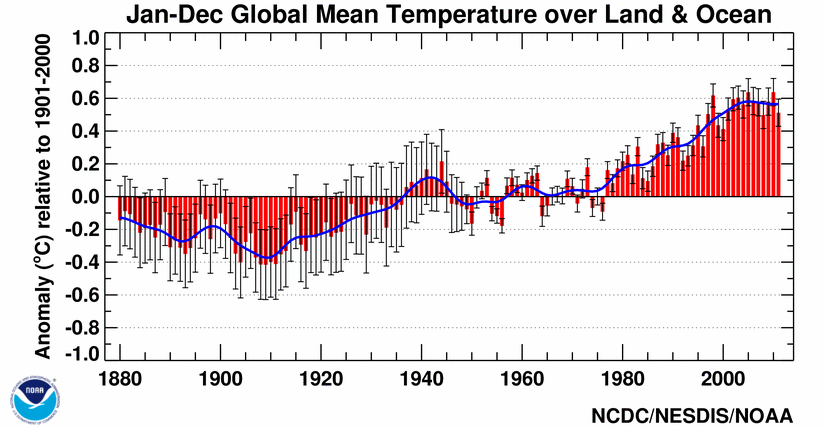
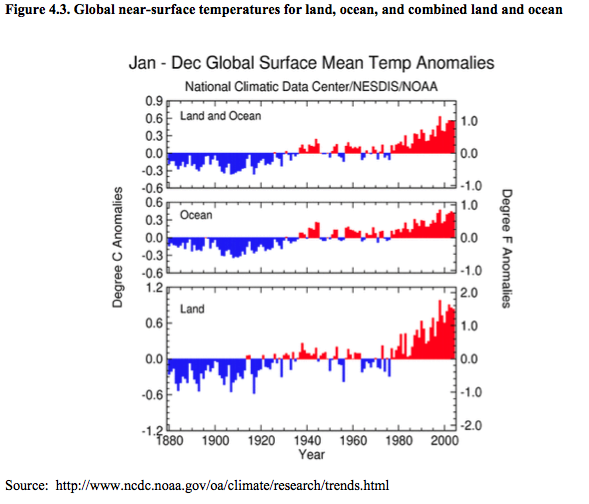
The warming of the globe does not match the cyclic nature of the ocean currents' temperature fluctuations. The land and the oceans are both warming at the surface even though the temperature of the ocean currents remains cyclic.

Global+near-surface+temperatures+for+land,+ocean,+and+combined+land+and+ocean.png

pdo-f-pg.gif

129_0.png
 
Last edited:
after further investigation and as I suspected, the AMO PDO and ENSO are all derived differently and should not be combined and/or used as anything but an indicator of local events.


World land and ocean temps combined are even more out of sync with ocean currents when looked at separately.

What do you see?

when I have the time I will come back and show you that land and ocean combined temps are out of sync with each other when the data come from different years. a 2012 version is substantially different than a 2007, 2002, 1997, etc version.
 
OK, we hear a lot of flap-yap about it not having warmed in the last 16 years. So what is the truth of the matter?


Global warming over the last 16 years - YouTube

16 years is about as long as a blink of an eye when it comes to climatology. Whether or not it's gotten warmer during this time period is irrelevant. It does not represent a trend either way.

I suppose these numbers do not represent a trend either, correct?

http://arctic.atmos.uiuc.edu/cryosphere/IMAGES/seaice.area.arctic.png

Nor these?

UAH v5.5 Global Temperature Update for December, 2012: +0.20 deg. C « Roy Spencer, Ph. D.

How about these?

[ame=http://www.youtube.com/watch?v=EoOrtvYTKeE]NASA | Temperature Data: 1880-2011 - YouTube[/ame]


No, they don't.
 
I laughed so hard when I saw this on DRUDGE today...............


It’s snowing, and it really feels like the start of a mini ice age
Something is up with our winter weather. Could it be the Sun is having a slow patch?

Now Piers has a very good record of forecasting the weather. He has been bang on about these cold winters. Like JMW Turner and the Aztecs he thinks we should be paying more attention to the Sun. According to Piers, global temperature depends not on concentrations of CO2 but on the mood of our celestial orb. Sometime too bright the eye of heaven shines, said Shakespeare, and often is his gold complexion dimmed. That is more or less right. There are times in astronomical history when the Sun has been churning out more stuff — protons and electrons and what have you — than at other times. When the Sun has plenty of sunspots, he bathes the Earth in abundant rays.

When the solar acne diminishes, it seems that the Earth gets colder. No one contests that when the planet palpably cooled from 1645 to 1715 — the Maunder minimum, which saw the freezing of the Thames — there was a diminution of solar activity. The same point is made about the so-called Dalton minimum, from 1790 to 1830. And it is the view of Piers Corbyn that we are now seeing exactly the same phenomenon today.

Lower solar activity means – broadly speaking – that there is less agitation of the warm currents of air from the tropical to the temperate zones, so that a place like Britain can expect to be colder and damper in summer, and colder and snowier in winter. “There is every indication that we are at the beginning of a mini ice age,” he says. “The general decline in solar activity is lower than Nasa’s lowest prediction of five years ago. That could be very bad news for our climate. We are in for a prolonged cold period. Indeed, we could have 30 years of general cooling.”

...............


It?s snowing, and it really feels like the start of a mini ice age - Telegraph


I love the comments section that follows.
 

Forum List

Back
Top