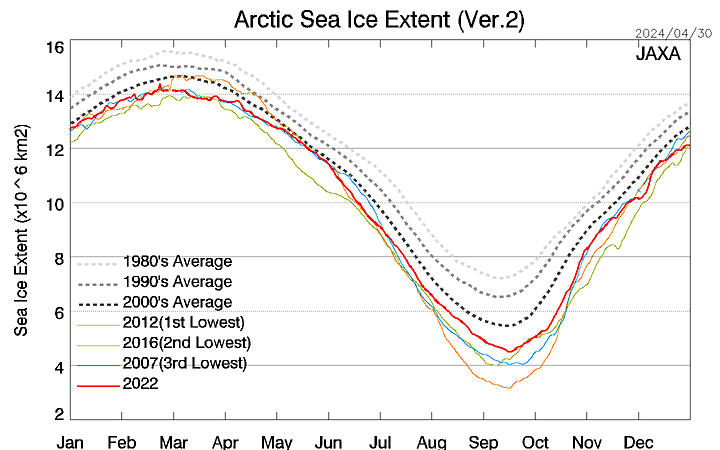
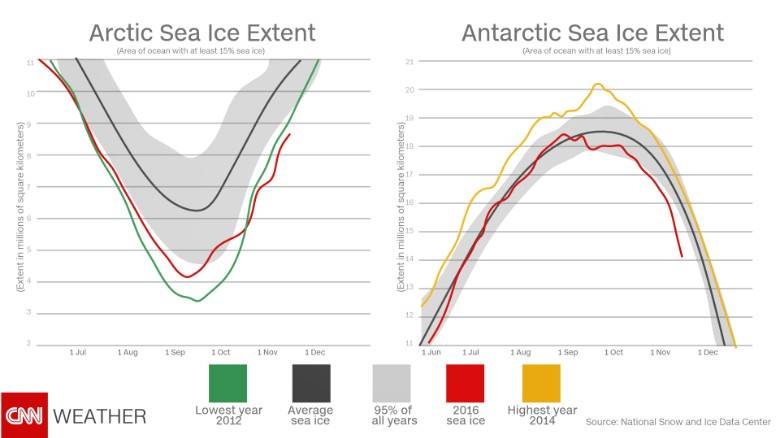
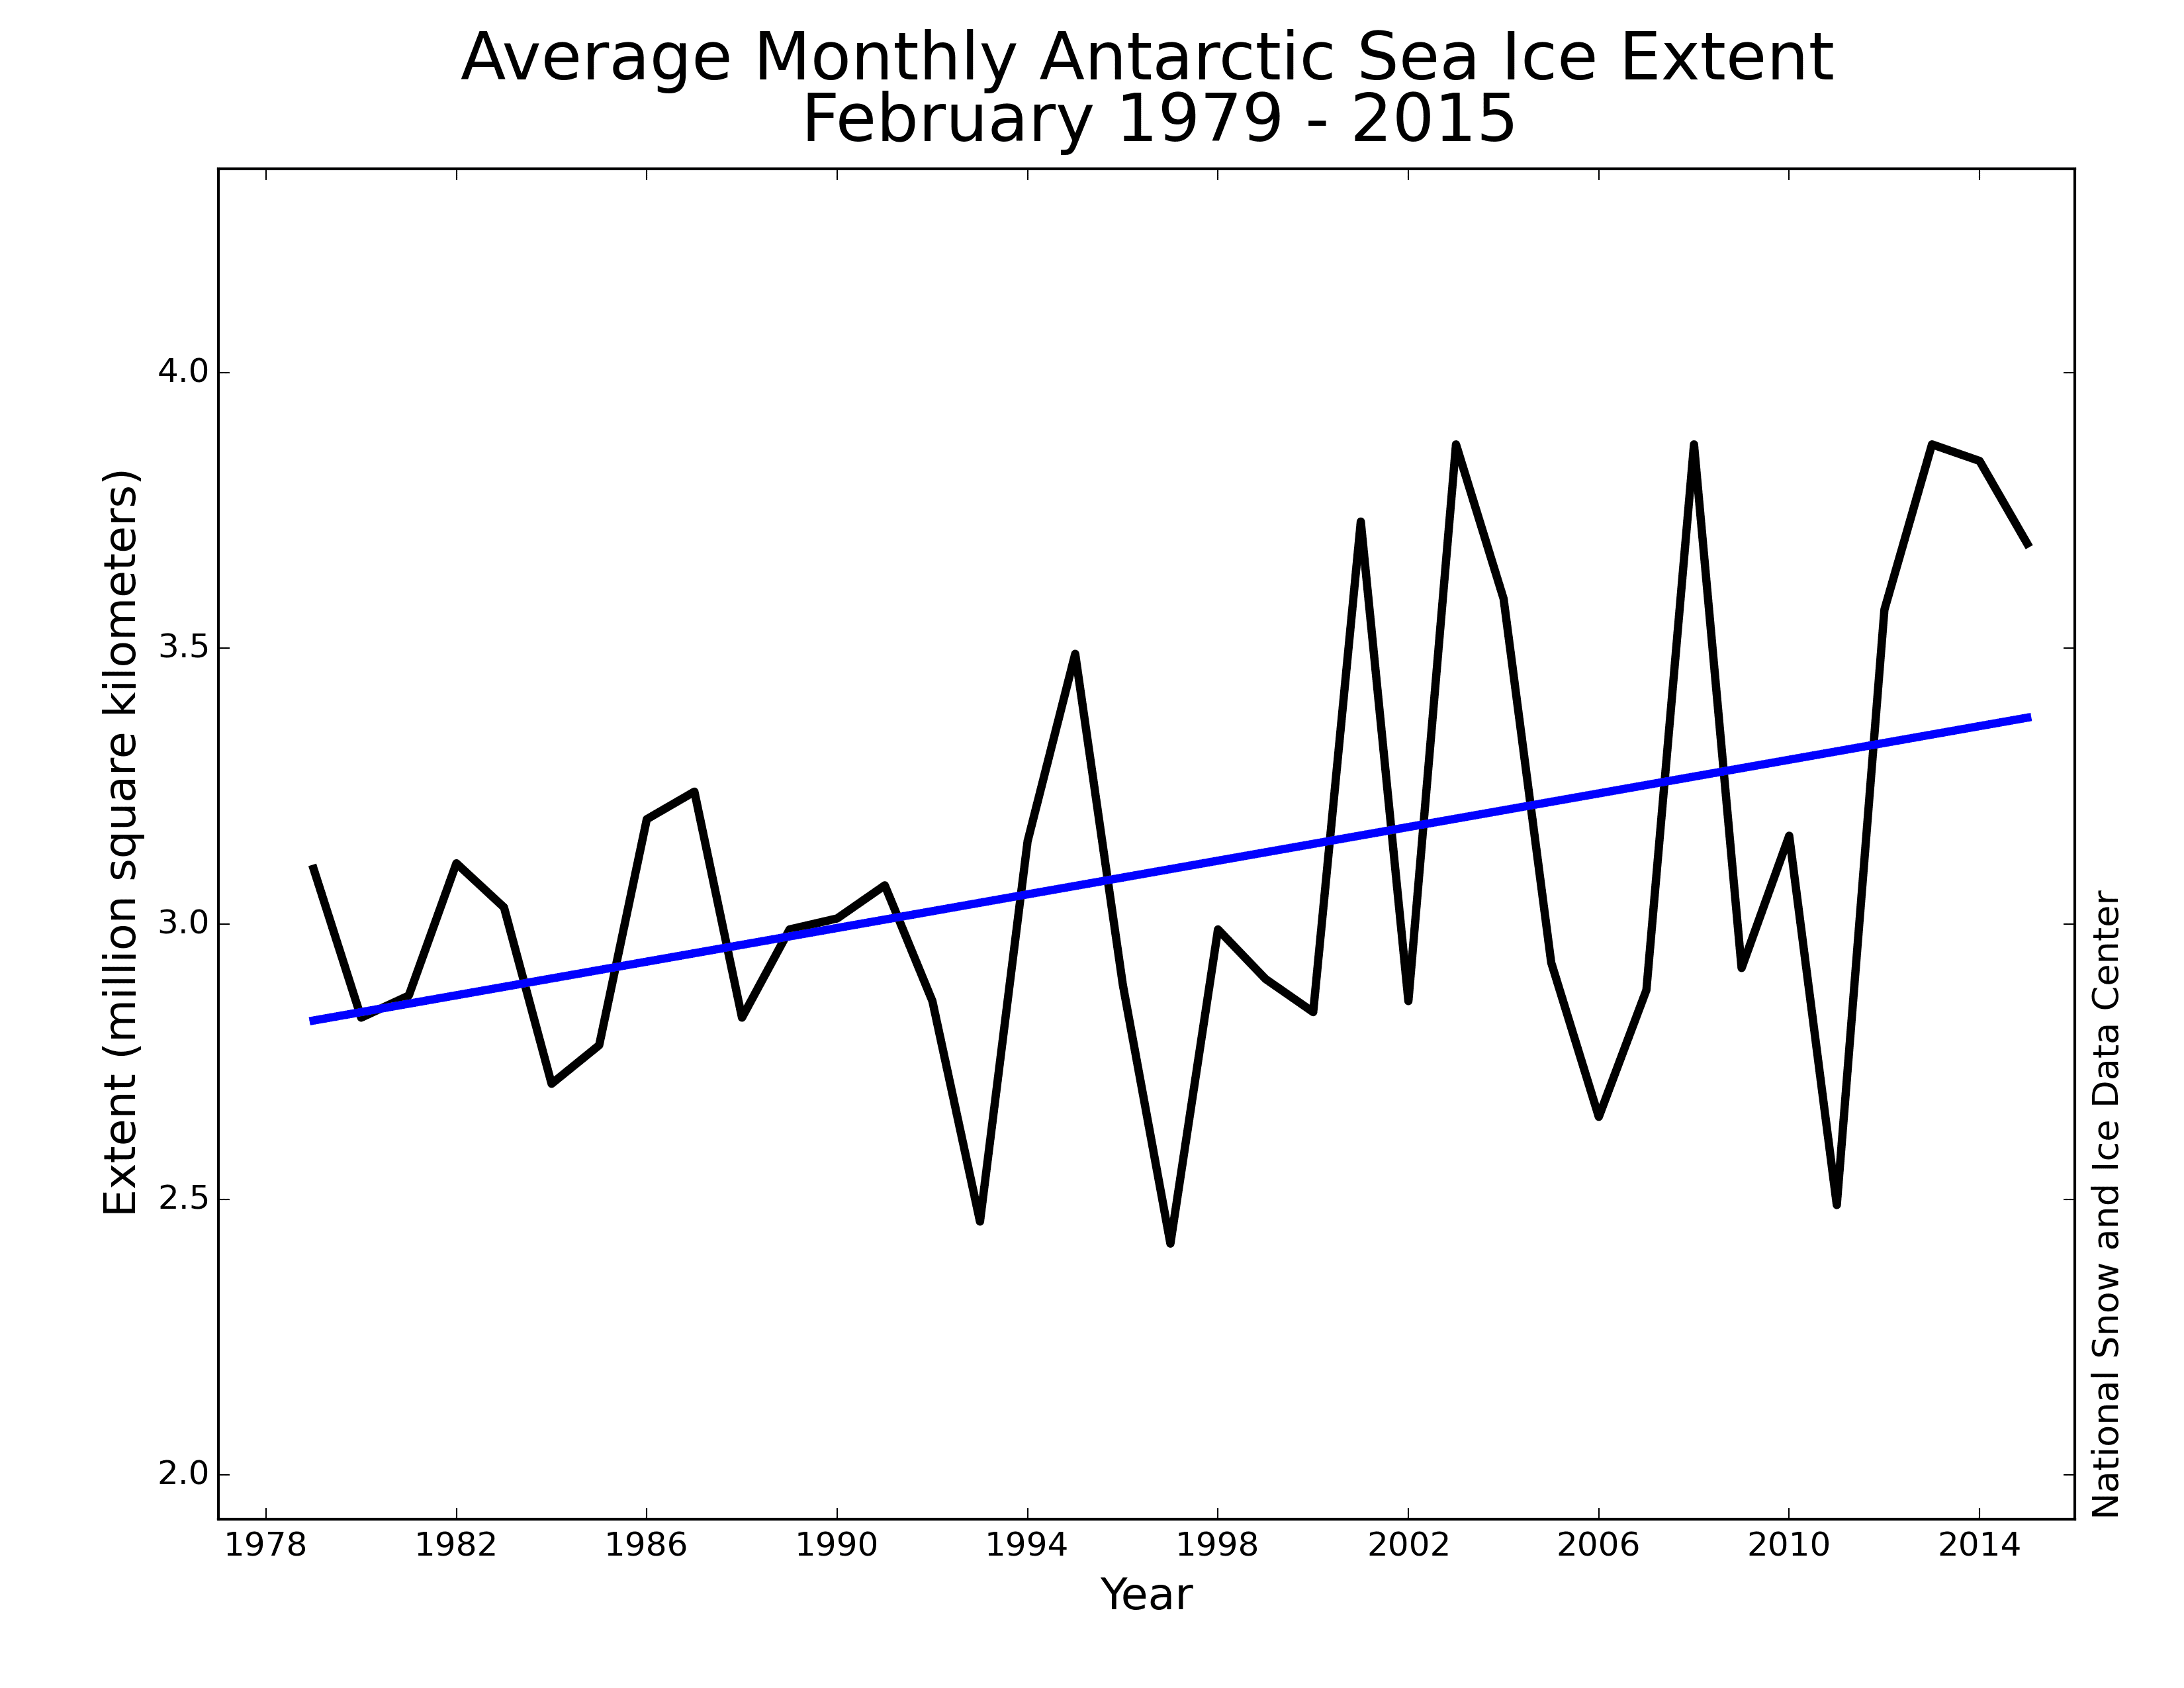
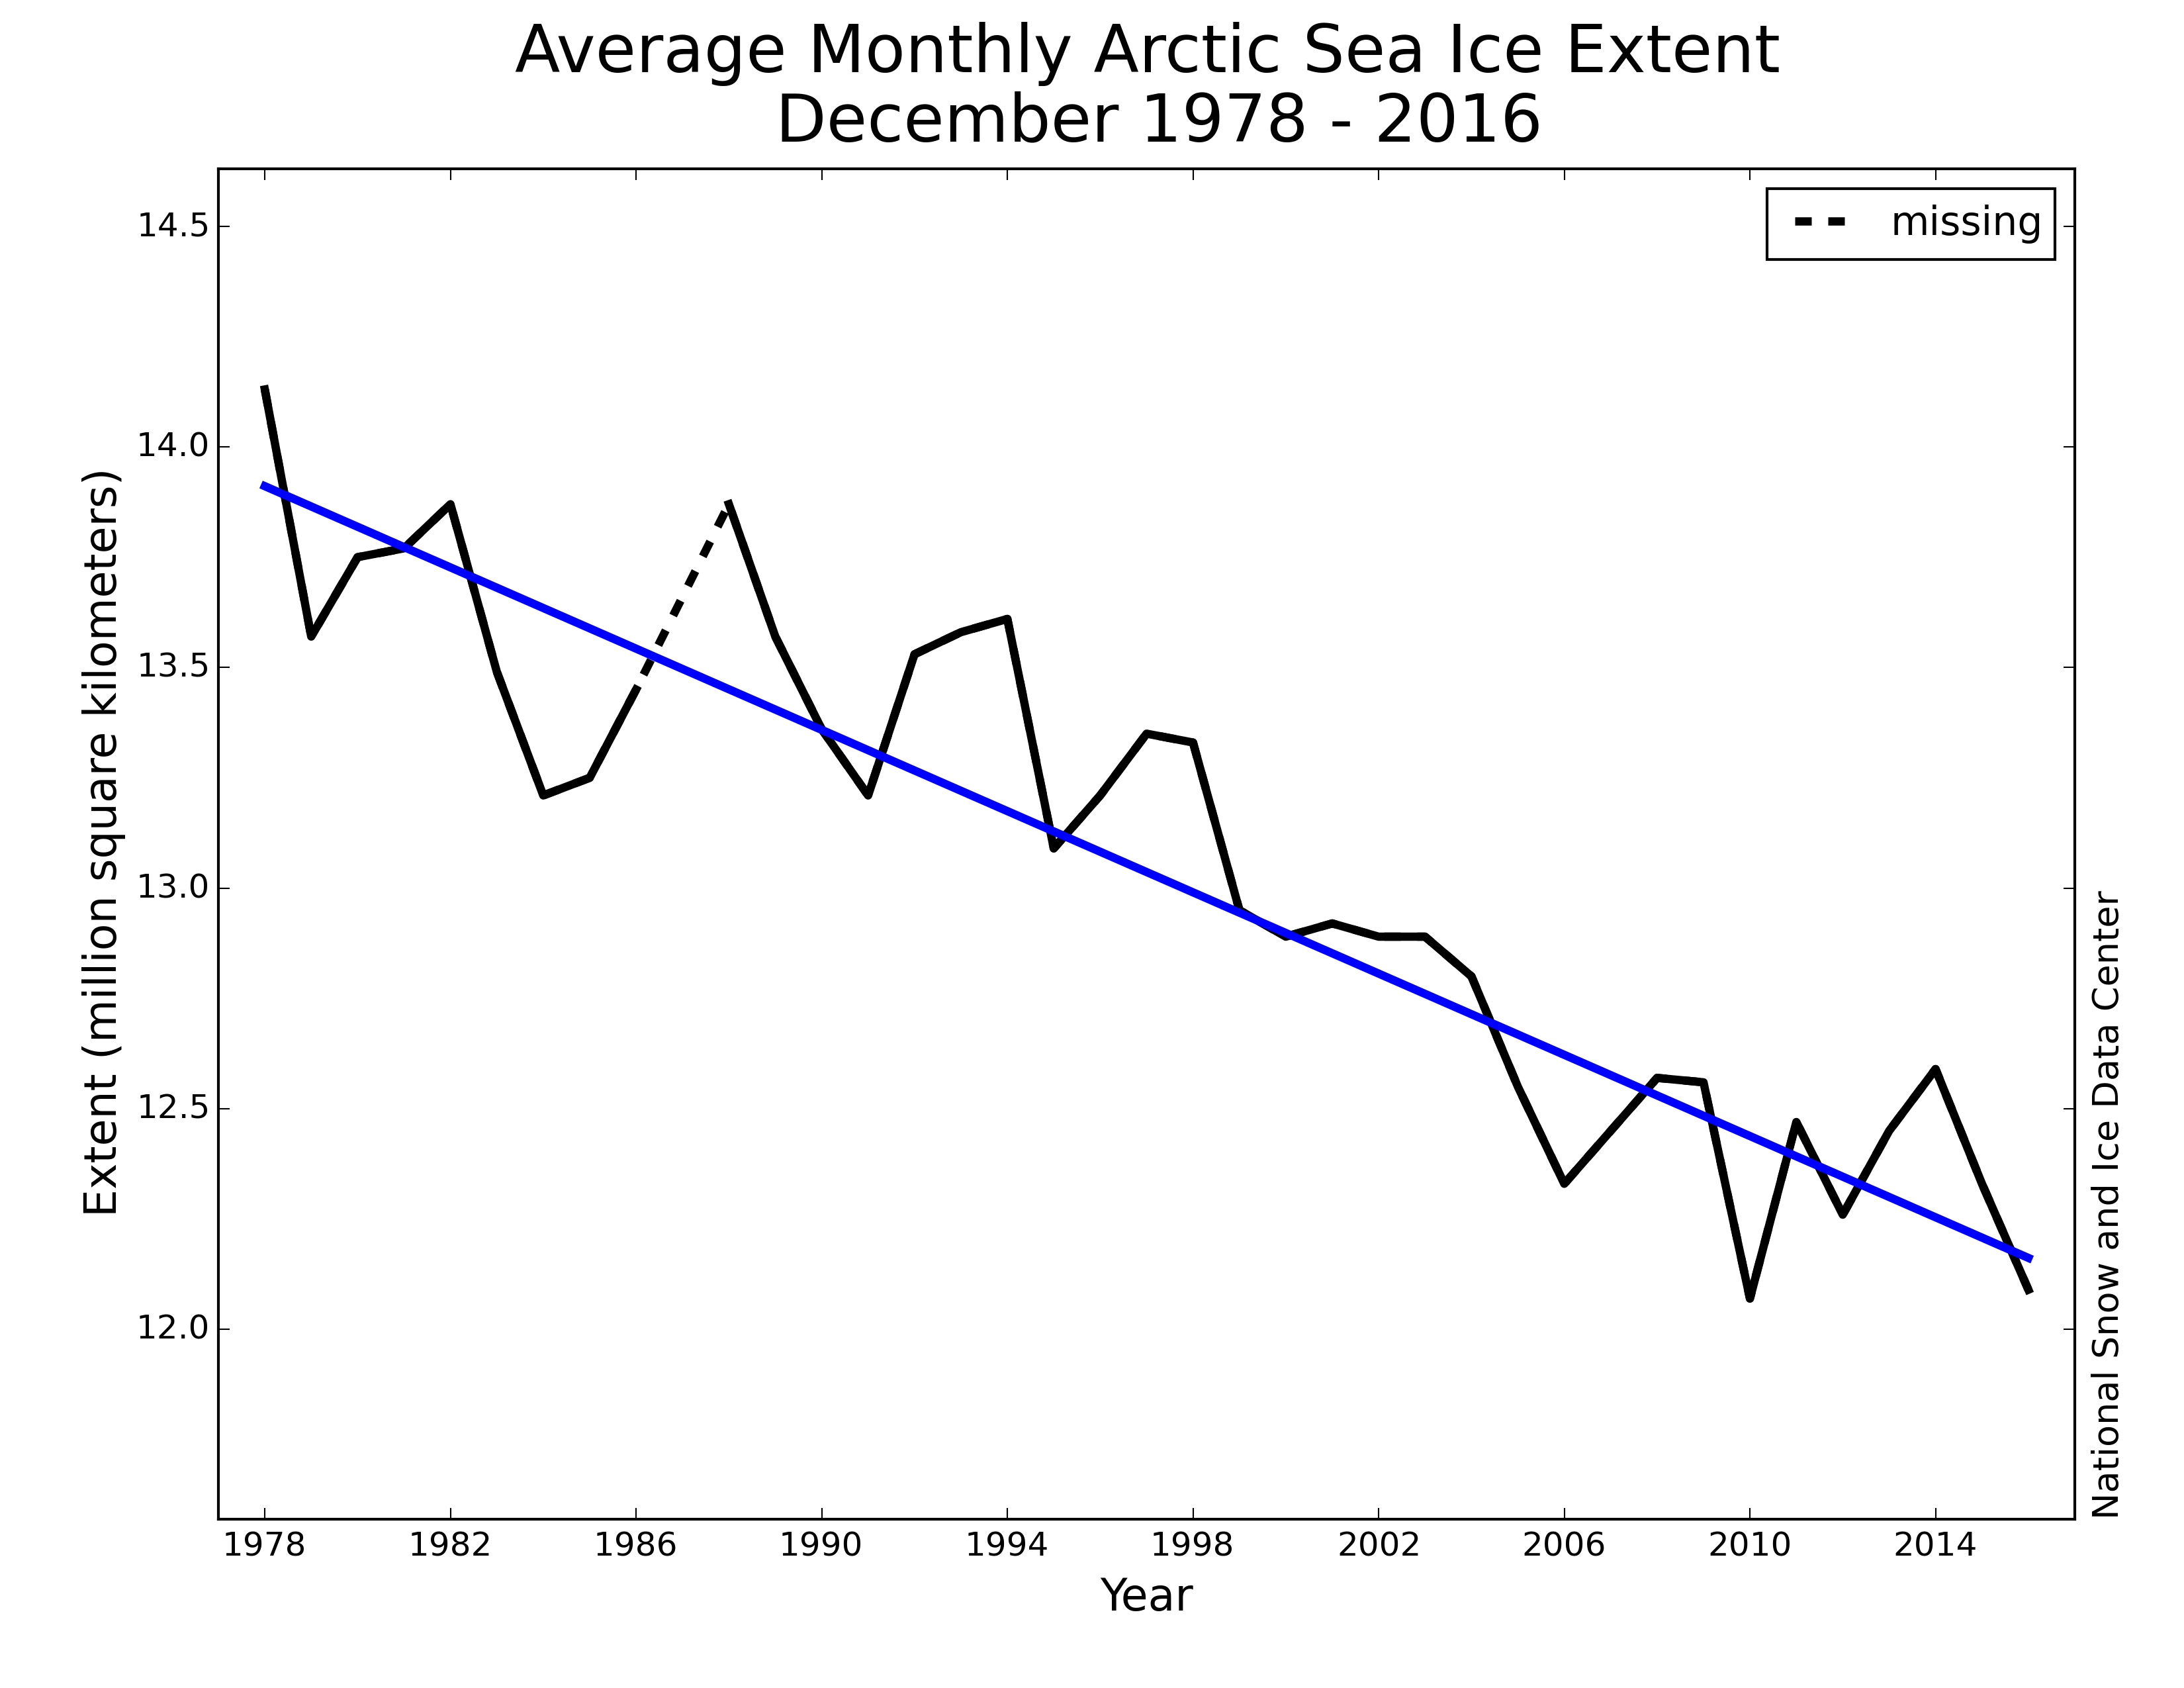
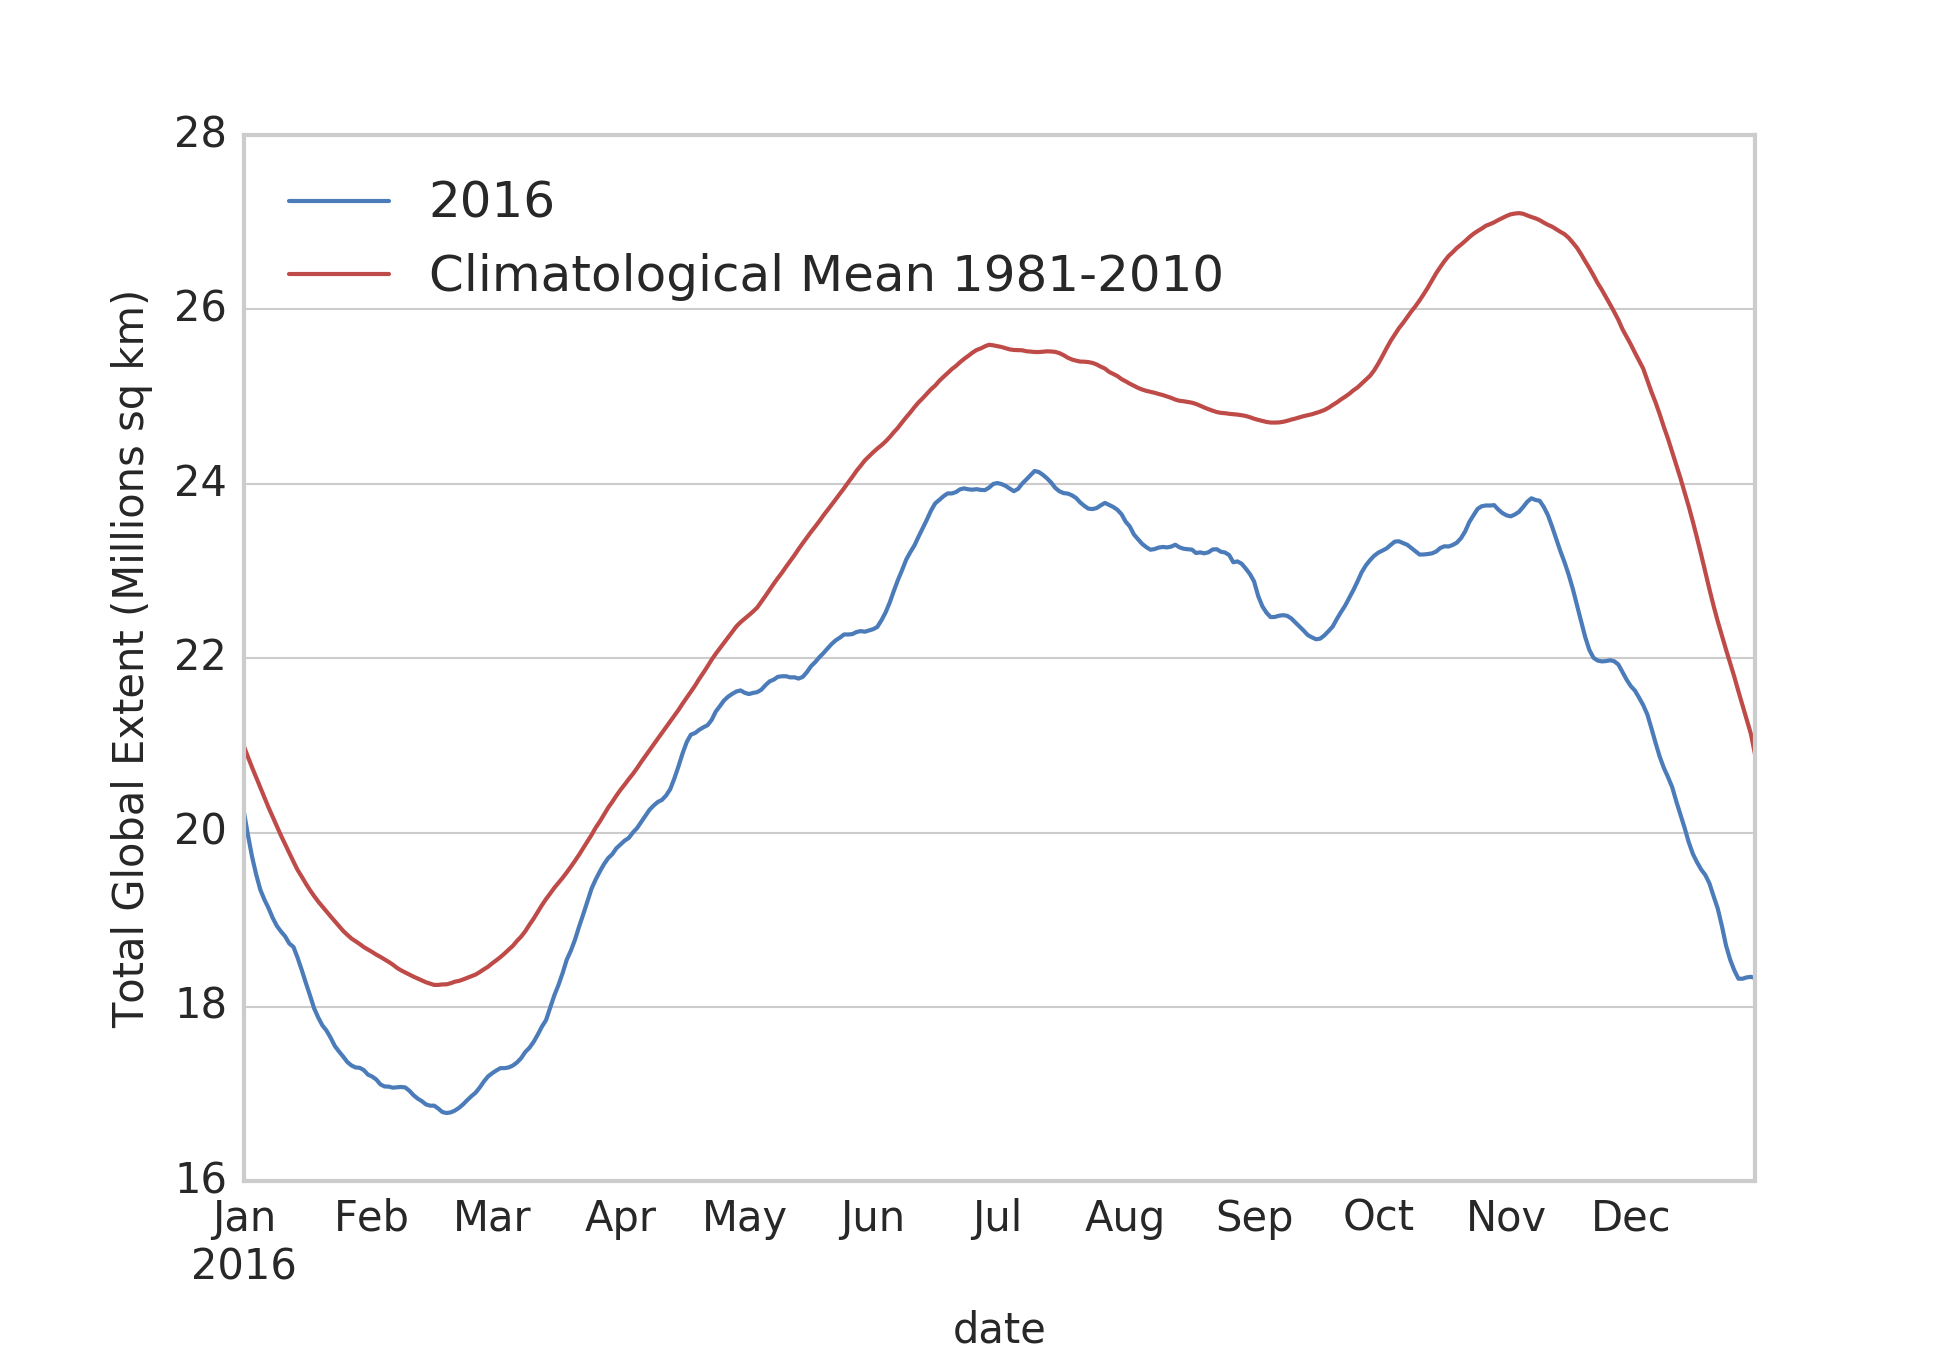
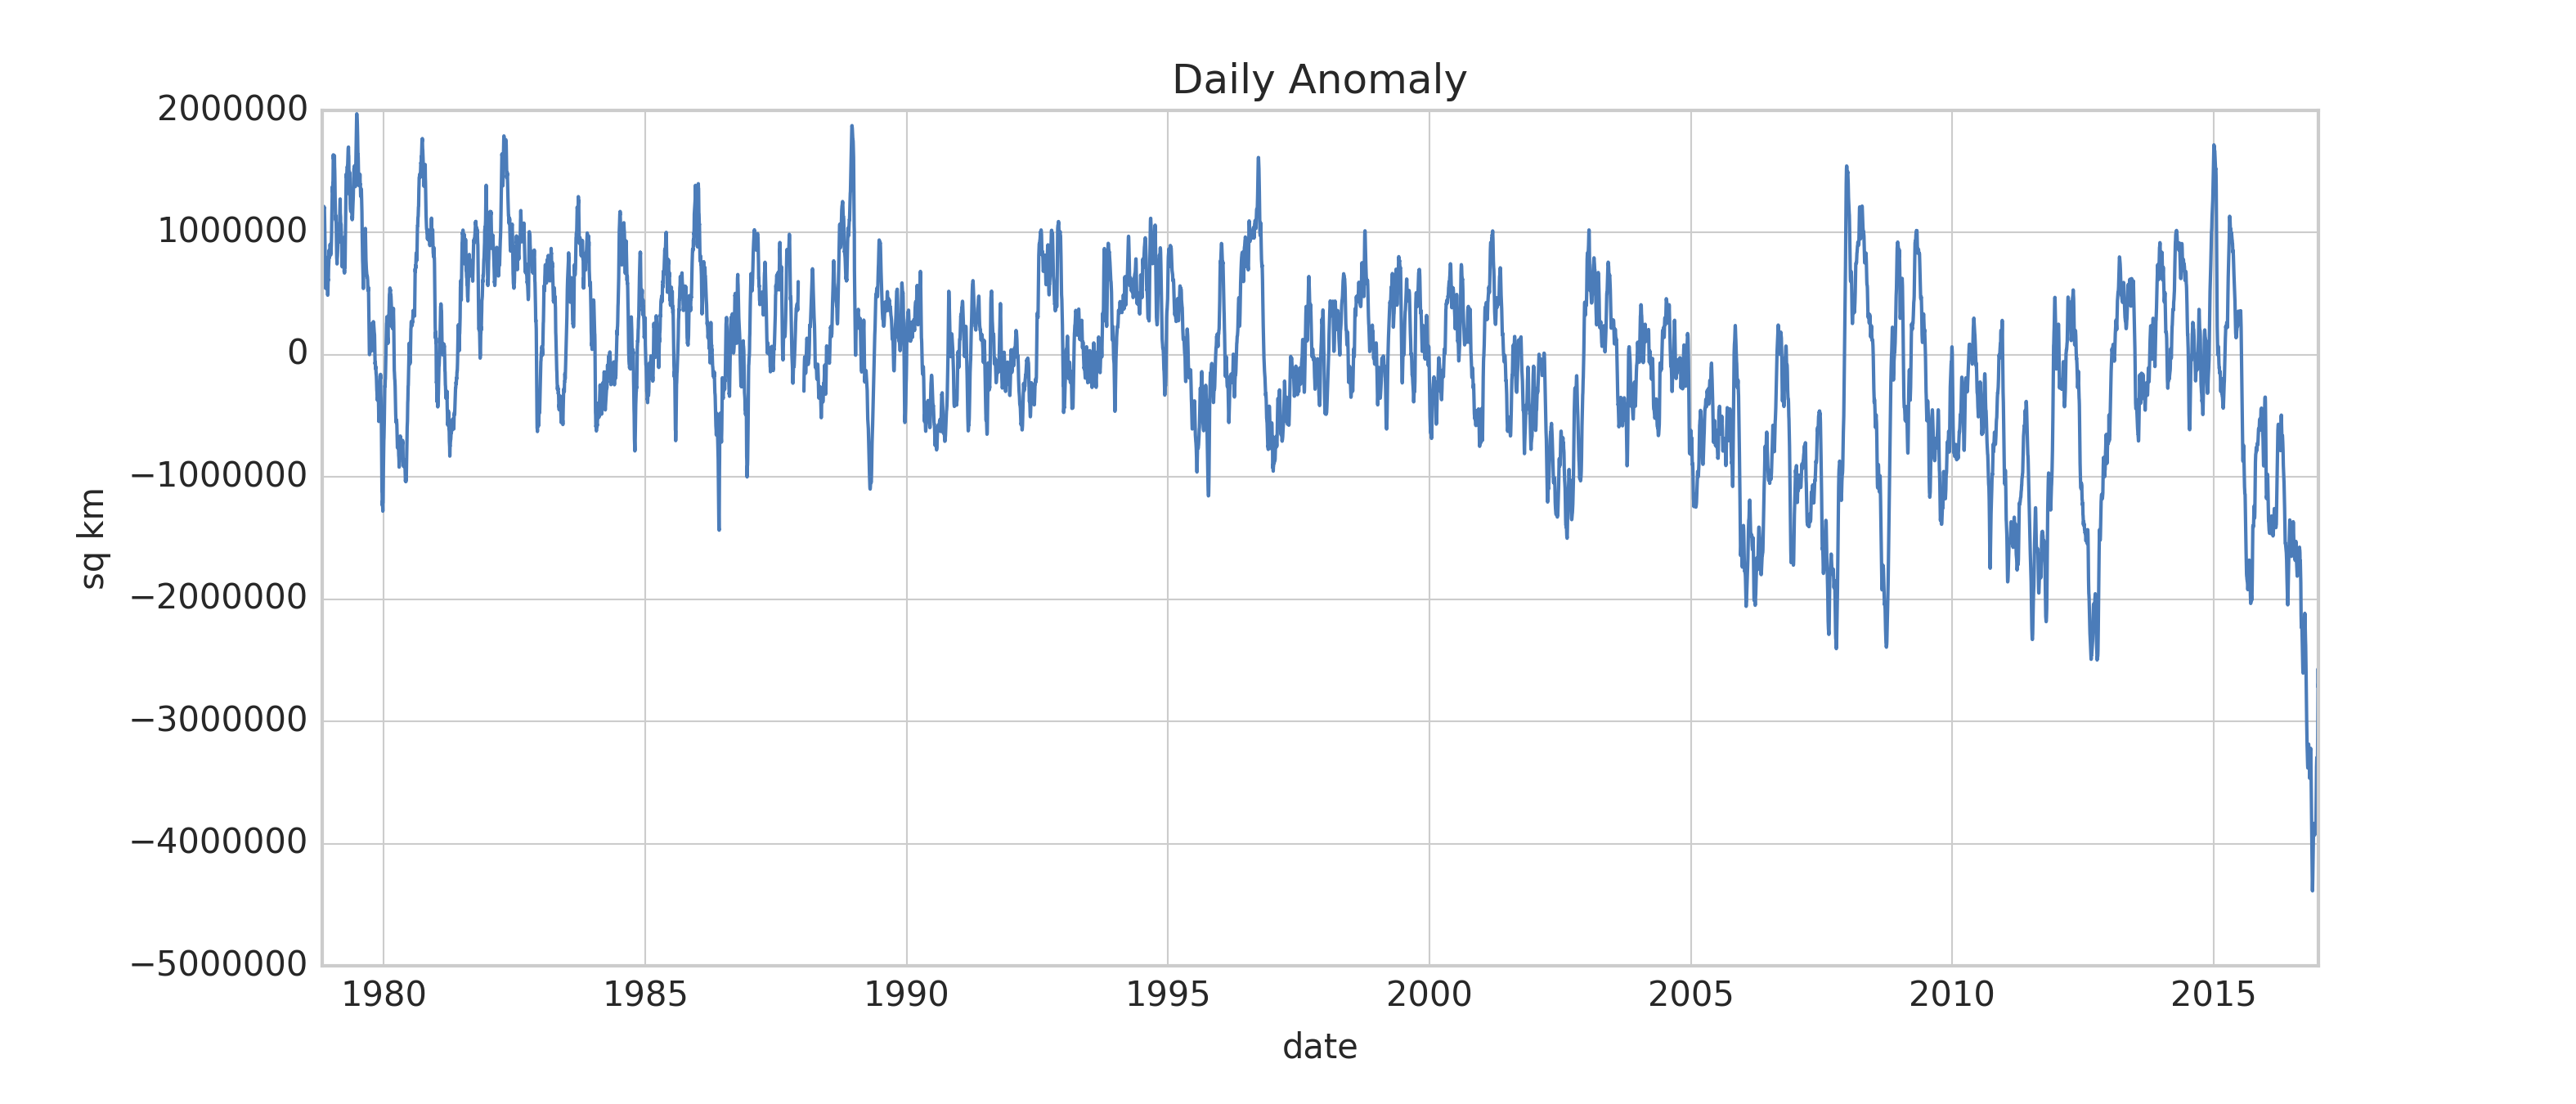
The ice caps are the planet's heat sink. When they fall apart, all kinds of feedbacks kick in and the climate goes to hell in short order. Here's a graph that shows planetary ice extent. Notice anything frightening about 2016?
View attachment 107464
More troublesome yet, there are gigatons worth of methane clathrates ready to melt and contribute more greenhouse gasses than the planet has seen in millions of years.
I'm not advocating action. We're past all that now.
Al Gore...is that you?