Navigation
Install the app
How to install the app on iOS
Follow along with the video below to see how to install our site as a web app on your home screen.
Note: This feature may not be available in some browsers.
More options
You are using an out of date browser. It may not display this or other websites correctly.
You should upgrade or use an alternative browser.
You should upgrade or use an alternative browser.
Former NOAA Scientist Confirms Colleagues Manipulated Climate Records
- Thread starter RWNJ
- Start date
Sunsettommy
Diamond Member
- Mar 19, 2018
- 15,178
- 12,747
- 2,400
As I have pointed out so many times before, when the Right get caught lying, they simply deflect and lie some more.Yuk...yuk.....that the climate change industry is engaged in fakery is not in dispute outside the club of the religion.....they promote the narrative by publicly displaying fake maps all the time. You know... those consistently real colorful ones....
realclimatescience.com/2017/02/nasa-noaa-climate-data
Really though this back and forth exercise on the credibility of the data really is akin to an exercise in group navel contemplation......or internet chatter if you prefer. Hobby stuff.....
In the end the only thing that matters is what the public thinks.... and that is the big problem for people who embrace the thinking of the religion.....like Ed. Waaasaay too many people see this as natural variability...... the evidence on that is staggering.
So really when it comes right down to it the whole debate about rigged data or straight data is immaterial in the real world.
Sorry s0ns.... just sayin'
Just as the lie in the OP had a fake chart when it was originally told, the above link has a fake station map.
The actual NOAA temperature station map:
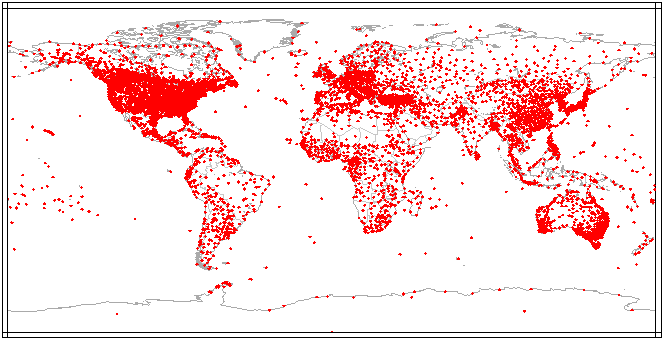
Fake data map from your above link showing almost no temperature stations in Africa;
That chart you call fake is straight from the NOAA. It says so right at the bottom left corner of the chart, which by the way is a MODEL!
Just because there is a station there doesn't mean it is active. You need to show that they actually work and collect every day.
You are having serious ocular difficulties today
SSDD
Gold Member
- Nov 6, 2012
- 16,672
- 1,966
- 280
As I have pointed out so many times before, when the Right get caught lying, they simply deflect and lie some more.Yuk...yuk.....that the climate change industry is engaged in fakery is not in dispute outside the club of the religion.....they promote the narrative by publicly displaying fake maps all the time. You know... those consistently real colorful ones....
realclimatescience.com/2017/02/nasa-noaa-climate-data
Really though this back and forth exercise on the credibility of the data really is akin to an exercise in group navel contemplation......or internet chatter if you prefer. Hobby stuff.....
In the end the only thing that matters is what the public thinks.... and that is the big problem for people who embrace the thinking of the religion.....like Ed. Waaasaay too many people see this as natural variability...... the evidence on that is staggering.
So really when it comes right down to it the whole debate about rigged data or straight data is immaterial in the real world.
Sorry s0ns.... just sayin'
Just as the lie in the OP had a fake chart when it was originally told, the above link has a fake station map.
The actual NOAA temperature station map:
Fake data map from your above link showing almost no temperature stations in Africa;
That chart you call fake is straight from the NOAA. It says so right at the bottom left corner of the chart, which by the way is a MODEL!
Just because there is a station there doesn't mean it is active. You need to show that they actually work and collect every day.
You are having serious ocular difficulties today
if it is from NOAA, chances are that it is fake...probably less instrumental coverage than they claim on the graph...
skookerasbil
Platinum Member
As I have pointed out so many times before, when the Right get caught lying, they simply deflect and lie some more.Yuk...yuk.....that the climate change industry is engaged in fakery is not in dispute outside the club of the religion.....they promote the narrative by publicly displaying fake maps all the time. You know... those consistently real colorful ones....
realclimatescience.com/2017/02/nasa-noaa-climate-data
Really though this back and forth exercise on the credibility of the data really is akin to an exercise in group navel contemplation......or internet chatter if you prefer. Hobby stuff.....
In the end the only thing that matters is what the public thinks.... and that is the big problem for people who embrace the thinking of the religion.....like Ed. Waaasaay too many people see this as natural variability...... the evidence on that is staggering.
So really when it comes right down to it the whole debate about rigged data or straight data is immaterial in the real world.
Sorry s0ns.... just sayin'
Just as the lie in the OP had a fake chart when it was originally told, the above link has a fake station map.
The actual NOAA temperature station map:
Fake data map from your above link showing almost no temperature stations in Africa;
That chart you call fake is straight from the NOAA. It says so right at the bottom left corner of the chart, which by the way is a MODEL!
Just because there is a station there doesn't mean it is active. You need to show that they actually work and collect every day.
You are having serious ocular difficulties today
Lol......but FaiL Sunset....i can't find an emoticon wearing glasses

Really though it's not an issue of eyesight for ED.... like all of the climate crusaders in this forum, they are fine with conveniently ignoring anything that doesn't fit the established narrative.
Billy_Bob
Diamond Member
It has been for some time, sadly. They do not address empirical evidence as it disproves every attempt, so far, to prove mans influence. If it is not manipulable for the cause it is not used.It is all models all the time with warmists...models all the way down.
Sunsettommy
Diamond Member
- Mar 19, 2018
- 15,178
- 12,747
- 2,400
As I have pointed out so many times before, when the Right get caught lying, they simply deflect and lie some more.Yuk...yuk.....that the climate change industry is engaged in fakery is not in dispute outside the club of the religion.....they promote the narrative by publicly displaying fake maps all the time. You know... those consistently real colorful ones....
realclimatescience.com/2017/02/nasa-noaa-climate-data
Really though this back and forth exercise on the credibility of the data really is akin to an exercise in group navel contemplation......or internet chatter if you prefer. Hobby stuff.....
In the end the only thing that matters is what the public thinks.... and that is the big problem for people who embrace the thinking of the religion.....like Ed. Waaasaay too many people see this as natural variability...... the evidence on that is staggering.
So really when it comes right down to it the whole debate about rigged data or straight data is immaterial in the real world.
Sorry s0ns.... just sayin'
Just as the lie in the OP had a fake chart when it was originally told, the above link has a fake station map.
The actual NOAA temperature station map:
Fake data map from your above link showing almost no temperature stations in Africa;
That chart you call fake is straight from the NOAA. It says so right at the bottom left corner of the chart, which by the way is a MODEL!
Just because there is a station there doesn't mean it is active. You need to show that they actually work and collect every day.
You are having serious ocular difficulties today
Ooops, I called the GHCNM chart a Model, it is actually the temperature based data.
THIS is a model, the other chart:
As you can see they infilled made up numbers in large areas on it. Satellite data shows it was much cooler
Last edited:
skookerasbil
Platinum Member
As I have pointed out so many times before, when the Right get caught lying, they simply deflect and lie some more.Yuk...yuk.....that the climate change industry is engaged in fakery is not in dispute outside the club of the religion.....they promote the narrative by publicly displaying fake maps all the time. You know... those consistently real colorful ones....
realclimatescience.com/2017/02/nasa-noaa-climate-data
Really though this back and forth exercise on the credibility of the data really is akin to an exercise in group navel contemplation......or internet chatter if you prefer. Hobby stuff.....
In the end the only thing that matters is what the public thinks.... and that is the big problem for people who embrace the thinking of the religion.....like Ed. Waaasaay too many people see this as natural variability...... the evidence on that is staggering.
So really when it comes right down to it the whole debate about rigged data or straight data is immaterial in the real world.
Sorry s0ns.... just sayin'
Just as the lie in the OP had a fake chart when it was originally told, the above link has a fake station map.
The actual NOAA temperature station map:
Fake data map from your above link showing almost no temperature stations in Africa;
That chart you call fake is straight from the NOAA. It says so right at the bottom left corner of the chart, which by the way is a MODEL!
Just because there is a station there doesn't mean it is active. You need to show that they actually work and collect every day.
You are having serious ocular difficulties today
Ooops, I called the GHCNM chart a Model, it is actually the temperature based data.
THIS is a model, the other chart:
View attachment 187886
As you can see they infilled made up numbers in large areas on
Ghey
And note where they highlight RECORD HEAT?
In central Africa.

Last edited:
Billy_Bob
Diamond Member
HOMOGENIZATION AND INFILLING are always positive influences on the average sum. Especially when they are covering large areas with no verification ability.As I have pointed out so many times before, when the Right get caught lying, they simply deflect and lie some more.Yuk...yuk.....that the climate change industry is engaged in fakery is not in dispute outside the club of the religion.....they promote the narrative by publicly displaying fake maps all the time. You know... those consistently real colorful ones....
realclimatescience.com/2017/02/nasa-noaa-climate-data
Really though this back and forth exercise on the credibility of the data really is akin to an exercise in group navel contemplation......or internet chatter if you prefer. Hobby stuff.....
In the end the only thing that matters is what the public thinks.... and that is the big problem for people who embrace the thinking of the religion.....like Ed. Waaasaay too many people see this as natural variability...... the evidence on that is staggering.
So really when it comes right down to it the whole debate about rigged data or straight data is immaterial in the real world.
Sorry s0ns.... just sayin'
Just as the lie in the OP had a fake chart when it was originally told, the above link has a fake station map.
The actual NOAA temperature station map:
Fake data map from your above link showing almost no temperature stations in Africa;
That chart you call fake is straight from the NOAA. It says so right at the bottom left corner of the chart, which by the way is a MODEL!
Just because there is a station there doesn't mean it is active. You need to show that they actually work and collect every day.
You are having serious ocular difficulties today
Ooops, I called the GHCNM chart a Model, it is actually the temperature based data.
THIS is a model, the other chart:
View attachment 187886
As you can see they infilled made up numbers in large areas on it. Satellite data shows it was much cooler
Similar threads
- Replies
- 115
- Views
- 3K
- Replies
- 63
- Views
- 2K
- Replies
- 648
- Views
- 9K
- Replies
- 21
- Views
- 714
Latest Discussions
- Replies
- 13
- Views
- 120
- Replies
- 186
- Views
- 1K
- Replies
- 3
- Views
- 35
- Replies
- 52
- Views
- 470
- Replies
- 138
- Views
- 936
Forum List
-
-
-
-
-
Political Satire 8870
-
-
-
-
-
-
-
-
-
-
-
-
-
-
-
-
-
-
-
ObamaCare 781
-
-
-
-
-
-
-
-
-
-
-
Member Usernotes 492
-
-
-
-
-
-
-
-
-
-