Employment Report

.

I'm afraid all the pieces are in place for a full and vibrant round of stagflation. Quite possibly worse, with the ability to double-short and triple-short (!) treasuries exacerbating the upcoming and inevitable bond market crash.

Hold on to your seats when that happens, gang.

Is stagflation inevitable too? Nope. But I'm beginning to think the only way out of this will be based more on emotion and psychology than fed tinkering.

.
 
Last edited:
He won't do it because he can't Beretta. This is just the Kool-Aid talking, nothing else.
He will make excuses for his messiah at any cost, which just makes himself look like an ignorant partisan hack that has a fetish for Rush.
YOU were the one who claimed that 300,000+ people who want jobs were removed from the books to attain a lower number, so the burden of proof is on you. Everyone with a working brain knows that the Boomers are retiring or becoming disabled.

Again, you will acknowledge retiring Boomers as soon as a Republican is president and the workforce participation rate continues to decline.


Uh, I'm not him, but you want proof. The Labor Participation Rate counts working age civilian workers, 16 and over. 53.4% of those workers between the age of 16 and 24 are UNEMPLOYED!

Now you tell me, since the unemployment rate in the general population is a rosy 8.1%, just who the HELL do you think is driving down the averages to 8.1...the 53% of 16 to 24 year old workers who are UNEMPLOYED or the VAST MAJORITY of baby boomers who ARE employed?

Since you seem to be either incapable or unwilling to follow Jroc's example and do the actual research to support your claim...AT LEAST use a little common sense please!


Huh, so it's trends you're after. Try this, it's called the Labor Force Participation Rate and it measures the percentage of WORKING AGE Civilian Americans, 16 and over. And the TREND in the work force participation rate is at 63% and falling at the FASTEST RATE EVER. That 63% represents the WORST work force participation rate since 1981. Care to guess what else that year was? You guessed it...the LAST year of Jimmy Carters reign of progressive terrorist assault on our economy!

Here is a little visual aid for ya straight off the Bureau of Labor Statistic site. It's the TREND form Bush's time in office right through the second coming of Carter...Obama. I'm sorry. I should take that back. That is an insult to CARTER'S economic prowess.

latest_numbers_LNS11300000_2002_2012_all_period_M08_data.gif

Do ya think ya notice a trend in that? How much of your complaining was about trends when Bush was in office?

And just so I don't get accused of hiding or misrepresenting anything, here is the graph from 1948 to today, when they started keeping the statistic.

latest_numbers_LNS11300000_1948_2012_all_period_M08_data.gif

If you look at it really close, you'll notice a really interesting trend. Beside you have to ignore the 40's and 50's because MOST of the population was fighting WWII and the Korean War and this is CIVILIAN workers. But that upward trend started with Kennedy, started up SHARPLY with Nixon and continued with every president up until the late 90's...EXCEPT for the Carter years, which were at least DEAD FLAT, starting at 63 and ending at 63...the general trend was UP until Bubba Clinton when it flattened off again!

In the late 90's, we got the dot com bubble busting and in 01 we got 9/11. THEN just about the time Bush had started the trend back up starting in 05...our economy got saddled with Pelosi and Reid in 06 and it's been all down hill since then!

You like trends? You can pretty much set your watch by which party is in the White House with the worker participation rate trends. And THOSE are trends you can go to the voting booth with!

I would not be complaining if a Republican POTUS was getting the results we are seeing given the same circumstances. I am interested in trends. The trend is toward the positive. Thus I am able to accept them as positive.

The trend is stagnation, LL.

Actually Meister...more like stagFLATION. ;~)

There is a blast from the past and it applies now...or it WOULD if politicians hadn't changed the formula for how inflation is calculated so even MORE of their dumb asses didn't get permanently booted out of politics over the word. ;~)
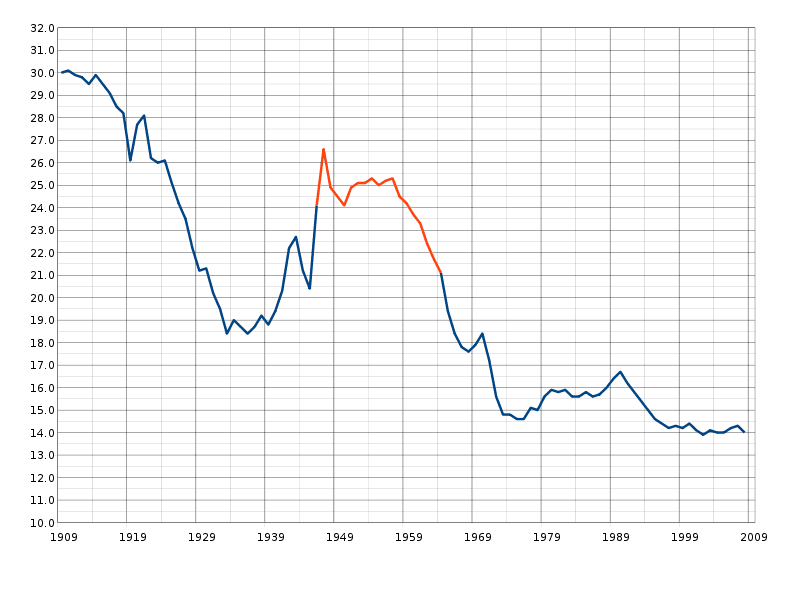
Actually those charts show the birth, work years, and retirement of the Boomers. The Boomers born in the 1940s start to enter the workforce in the 1960s, just when your chart starts its rise, and were first able to retire in 2008 as they turned 62. You can expect the Labor Force Participation rate to decline for the next 15 years as the Boomers continue to retire no matter which Party is in the White House.

795px-US_Birth_Rates.svg.png

United States birth rate (births per 1000 population).[2] The United States Census Bureau defines the demographic birth boom as between 1946 and 1964[3] (red).
 
You're full of it Eddie even Obama isn't using your bullshit excuse


Civilian+Labor+Force+Participation+Rate+by+Age.jpg


There are fewer people in the three older age groups per year than there are in the three young age groups. In particular, there are fewer people of any age from 55 to 66, which are Baby Boomer years, than there are in the 16, 17, 18, or up to 29 years old individual years. So, while the bulge of Baby Boomers is significant in terms of health care costs and Social Security costs, it is not the cause even in part of the drop in the overall population labor participation rate. There are more potential workers entering the employment pipeline than are exiting it. Unfortunately, those who may wish to enter the pipeline are not being hired.


An Objectivist Individualist: Are Retiring Baby Boomers Causing the Labor Force Participation Rate to Drop?
First of all the Boomers were born from 1946 to 1964 and those born in 1964 are 48 years old today, not 55 as your source misrepresents. And more importantly, Boomers are not the only age group who are retiring!!! Your source does not even mention that there are 26 million people over the age of 69, a larger group than any listed by your source, and some of them retire also!

As a result, more workers are leaving the workforce than new workers entering. See figure 1 in link.

Fundamentals Feb 2012 Dirt Economics Demographics Matter

The demographics trends in Figure 1 show that, in the early 2000s, there were 10 new entrants into the workforce for every retiree; by 2020, that ratio will invert and show one new worker for every 10 retirees.

Our economy would collapse long before any 10 to 1 Ratio!! You’re out of your mind, I don’t even have to look at such stupidity. Young adult uemployment is almost 17% as i posted earlier
 
Does the " no longer looking fo work" include those who have retired from the workforce?

Those "no longer looking for work" are the baby boomer retirees that Ed's referring to as retired.

The "no longer looking for work" are the people who just gave up looking and those that their benefits have expired.
Labor Force Characteristics (CPS)

Not in the labor force
Persons who are neither employed nor unemployed are not in the labor force. This category includes retired persons, students, those taking care of children or other family members, and others who are neither working nor seeking work.
 
Does the " no longer looking fo work" include those who have retired from the workforce?

To my knowledge, no.
Those once counted were drawing unemployment and have exhausted those benefits. Once that occurs, the person is no longer counted as unemployed if he or she does not find employment. Consequently, the person for purposes of counting the unemployed, no longer counts in the BLS figures.
This is why I pay no attention to the U-3 rate which is the one reported. The U-6 which is ACTUAL number of unemployed is a much better figure to use.
Because this number(U-6) is roughly double the U-3 it is not used because it is a political landmine. Americans just do not want to see large numbers they perceive as being bad news. In the minds of most people "8" is a MUCH smaller amount than "14"..
Lying bullshit!
 
Does the " no longer looking fo work" include those who have retired from the workforce?

To my knowledge, no.
Those once counted were drawing unemployment and have exhausted those benefits. Once that occurs, the person is no longer counted as unemployed if he or she does not find employment. Consequently, the person for purposes of counting the unemployed, no longer counts in the BLS figures.
This is why I pay no attention to the U-3 rate which is the one reported. The U-6 which is ACTUAL number of unemployed is a much better figure to use.
Because this number(U-6) is roughly double the U-3 it is not used because it is a political landmine. Americans just do not want to see large numbers they perceive as being bad news. In the minds of most people "8" is a MUCH smaller amount than "14"..

Can you support that?
 
Does the " no longer looking fo work" include those who have retired from the workforce?

To my knowledge, no.
Those once counted were drawing unemployment and have exhausted those benefits. Once that occurs, the person is no longer counted as unemployed if he or she does not find employment. Consequently, the person for purposes of counting the unemployed, no longer counts in the BLS figures.
This is why I pay no attention to the U-3 rate which is the one reported. The U-6 which is ACTUAL number of unemployed is a much better figure to use.
Because this number(U-6) is roughly double the U-3 it is not used because it is a political landmine. Americans just do not want to see large numbers they perceive as being bad news. In the minds of most people "8" is a MUCH smaller amount than "14"..
Lying bullshit!

No..You don't get to say "LIE" without explaining yourself.
Come up with some facts. Drive by whiney posts are not tolerated.
Come back when you are prepared to discuss the subject. Instead of just crying about it.
Portal Seven | U6 Unemployment Rate
Table A-15. Alternative measures of labor underutilization

Maybe there are others who will let you get away with your shit, not me.
The current percentage of unemployed workers according to the BLS is 14.7%...14.6 seasonally adjusted.
 
Does the " no longer looking fo work" include those who have retired from the workforce?

To my knowledge, no.
Those once counted were drawing unemployment and have exhausted those benefits. Once that occurs, the person is no longer counted as unemployed if he or she does not find employment. Consequently, the person for purposes of counting the unemployed, no longer counts in the BLS figures.
This is why I pay no attention to the U-3 rate which is the one reported. The U-6 which is ACTUAL number of unemployed is a much better figure to use.
Because this number(U-6) is roughly double the U-3 it is not used because it is a political landmine. Americans just do not want to see large numbers they perceive as being bad news. In the minds of most people "8" is a MUCH smaller amount than "14"..

Can you support that?

Look in subsequent post.
I find it incredible that some of you have never heard of or choose to ignore this data.

Not that......this:

To my knowledge, no.
 
Does the " no longer looking fo work" include those who have retired from the workforce?

Those "no longer looking for work" are the baby boomer retirees that Ed's referring to as retired.

The "no longer looking for work" are the people who just gave up looking and those that their benefits have expired.
Labor Force Characteristics (CPS)

Not in the labor force
Persons who are neither employed nor unemployed are not in the labor force. This category includes retired persons, students, those taking care of children or other family members, and others who are neither working nor seeking work.

To my knowledge, no.
Those once counted were drawing unemployment and have exhausted those benefits. Once that occurs, the person is no longer counted as unemployed if he or she does not find employment. Consequently, the person for purposes of counting the unemployed, no longer counts in the BLS figures.
This is why I pay no attention to the U-3 rate which is the one reported. The U-6 which is ACTUAL number of unemployed is a much better figure to use.
Because this number(U-6) is roughly double the U-3 it is not used because it is a political landmine. Americans just do not want to see large numbers they perceive as being bad news. In the minds of most people "8" is a MUCH smaller amount than "14"..
Lying bullshit!

No..You don't get to say "LIE" without explaining yourself.
Come up with some facts. Drive by whiney posts are not tolerated.
Come back when you are prepared to discuss the subject. Instead of just crying about it.
Portal Seven | U6 Unemployment Rate
Table A-15. Alternative measures of labor underutilization

Maybe there are others who will let you get away with your shit, not me.
The current percentage of unemployed workers according to the BLS is 14.7%...14.6 seasonally adjusted.
The highlighted part is a pure lie, believed by fools and parroted by idiots.

And nobody uses the U-6 rate for Republican presidents. And the U-6 rate is the UNDERemployment rate, so you are lying again when you say it is "the percentage of unemployed workers."
 

Forum List

Back
Top