Duke Physicists Call Out NASA and NOAA's Adjustments as improbable..

The adjustments make the total warming look smaller.

The conspiracy theory claims the opposite.

Therefore, the conspiracy theory is nonsense.

It all comes back to that basic fact, no matter how many deflections and cherrypicks are attempted. That's why all the rational people correctly recognize the conspiracy theory as nonsense.

If conspiracy cultists want their theory to gain any traction outside of the cult, they have to explain why anyone should believe a theory that claims the direct opposite of reality.

But if the conspiracy cultists are satisfied with preaching to the choir and accomplishing zilch, while the science happily moves on without them, they should keep on doing exactly what they're doing.

And if you have trouble with Nick Stokes, go debate it over there. If you're so sure of yourself, have the courage to run with the big boys.

(And jc? Stop whine-stalking me. If you have nothing productive to say, don't say it.)
funny stuff tooth. seventeen months I've been on here and yet to see the evidence that supports any of this as fact. Please provide us a link, a graph, something that confirms and validates what you just said. Sounds more like you're the one doing the whining because I keep calling out the fact you have zip as evidence.

BTW, that would be a graph from years ago with a graph from today. simple stuff.
 
I've post6ed the graphs before. Like you always do, you pretended not to see them, and then immediately spun about and claimed they'd never been posted.

So, go pound sand, liar.

And stop stalking me.
 
Actually Mammy's hero criticizing Goddard is just changing the subject. There are 2 different methodologies that point out different things..

If you only take FINAL adjustment for each date -- you simply get a SNAPSHOT of the MULTITUDE of corrections that has been visited upon that year or month.. Doesn't show anything about the PATTERN of corrections that has been applied over time. So for instance -- the Prez is gonna speechify on CC in a week and the movement needs a scary press release on some mundane JULY all time record. You boost the adjustments by a couple hundreths of a degree in order to make that record -- and week later -- you can put it back where it was.. Think that CAN'T happen??? GISS has acknowledged revising down "records" after those all important press releases.. And/or "lowering their confidence" in the fact the record really occurred.

Meanwhile, Goddard wants to show the total range of corrections applied to a date -- like Jan 1939.. So that he averages ALL the corrections for that date to show general bias in the correction history..

Two different goals. I want to know more about what Goddard is after. And couldn't care less about what the adjustments show TODAY or yesterday. Because they are CONSTANTLY being fillet'd, cooked and fricassee'd.

I believe what Steve is trying to do is show that the adjustments are done with forethought and malice. The compiled adjustments are so massive that no one with a lick of common sense would believe them.

The historical record is so badly screwed up that it is no longer fit for any use, public, private, or policy making. And that is very sad indeed.


I agree. The apologists for GISS, BEST, etc have said that the obviously incorrect adjustments to places like Iceland don't matter because it is only the overall global temp that they are interested in. Instead of using their mistakes to fix the weaknesses in the algorithms they just ignore the problems.
 
It would be interesting to see a maturity graph of sea surface temps over the last few decades. The Pooh flinging monkey says that they have not been adjusted to cool the past warm the present and smooth out inconvenient bumps. I believe they have.
 
I've post6ed the graphs before. Like you always do, you pretended not to see them, and then immediately spun about and claimed they'd never been posted.

So, go pound sand, liar.

And stop stalking me.
stalking? I thought this was a forum and interaction between the parties to get to the truth. You don't see it that way? I'm sorry, seems you wish to only dictate to us. I'll leave you alone, once you provide the evidence to the shuck and jive information you post. you claim to have presented the graphs, ok, what do I search for on the tool. I'll be glad to use the provided tool in the forum. Give me a graph name and I'll go look.

But until then, I'm not the only one stating you didn't provide it. so, seems it's an issue with your computer I supposed, it didn't make it in the forum.

But I will search, give me the graph name.
 
I've post6ed the graphs before. Like you always do, you pretended not to see them, and then immediately spun about and claimed they'd never been posted.

So, go pound sand, liar.

And stop stalking me.
which one of these is it in? I searched under graph and your poster name. Which one of these shows past graphs against current graphs with the changes how you state?

Forums Search >
Search Results for Query: graph
Search Again
Page 1 of 6
1 2 3 4 5 6 Next >

  1. Post
    Climate change
    Here's the actual AR5 graph. A few deniers, for inexplicable reasons, ignore the real graph and use an early draft that everyone agrees was...
    Post by: mamooth, Friday at 7:28 PM in forum: Environment

  2. Post
    India heatwave toll nears 1,000
    So precisely what was your graph that ended in Jan 2014 supposed to prove about current El Nino conditions?
    Post by: mamooth, May 26, 2015 in forum: Environment

  3. Post
    Duke Physicists Call Out NASA and NOAA's Adjustments as improbable..
    Could you tell us where your mystery graph comes from, exactly what it's supposed to be portraying, and point specifically what data was used to...
    Post by: mamooth, Sunday at 3:11 PM in forum: Environment

  4. Post
    Arctic sea ice hits record low
    So you cut off your graph at 2000 and then claim to be an honest data broker? Does not compute. And you're using CultOfMcIntyre nonsense, which...
    Post by: mamooth, Mar 21, 2015 in forum: Environment

  5. Post
    The Planet Just Had Its Hottest October On Record
    You know that's a fudged graph, Kosh, yet you still use it. That says everything anyone needs to know about you.
    Post by: mamooth, Nov 16, 2014 in forum: Environment

  6. Post
    10,000-year-old Antarctic ice shelf will disappear by 2020
    So you think posting more of your faked data proves ... what? I mean, besides that you openly support fraud.
    Post by: mamooth, May 24, 2015 in forum: Environment

  7. Post
    The Arctic is already effectively ice free
    ...back to the topic of Arctic sea ice. Charctic Interactive Sea Ice Graph Arctic Sea Ice News and Analysis Ice extent is below 2013 and 2014...
    Post by: mamooth, Aug 6, 2015 in forum: Environment

  8. Post
    The Global Warmers Have Lost the War
    Kosh, given your graph shows how severe current warming is compared the recent past, why post it? Are you trying to prove our point? Oh, are you...
    Post by: mamooth, May 15, 2015 in forum: Environment

  9. Post
    The Global Warmers Have Lost the War
    Who was Cecilius? Was he a Roman emperor? Why are you quoting his degrees? I assume he must have had a doctorate, right? By the way, how's your...
    Post by: mamooth, May 15, 2015 in forum: Environment

  10. Post
    Thousands March Through Snow Protesting Global Warming
    Christy's fudged graph? And you expect not to be laughed at? And no, cold doesn't cause blizzards. You are completely clueless about weather. No...
    Post by: mamooth, Apr 14, 2015 in forum: Environment

  11. Post
    Antarctic ice shelf thinning accelerates
    ...using it to lie big. So, exactly where did you get your fudged graph? That is, tell everyone the exact steps necessary to reproduce it on KNMI...
    Post by: mamooth, Apr 12, 2015 in forum: Environment

  12. Post
    USA - China Climate Deal
    Check it out. Skook posts a pre-agreement graph to describe the post-agreement world. Skook, do you understand just how 'effin stupid you are?...
    Post by: mamooth, Nov 17, 2014 in forum: Environment

  13. Post
    Antarctic ice shelf thinning accelerates
    ...us a single actual source. Provide the links that show where your graphs actually came from, and someone might believe you're not posting faked...
    Post by: mamooth, Apr 13, 2015 in forum: Environment

  14. Post
    tied for hottest June in record history---Nasa.
    Sure. The recent positive acceleration in sea level rise destroys your theory, as you theory says sea level rise should be having a negative...
    Post by: mamooth, Jul 17, 2015 in forum: Environment

  15. Post
    Tracking the el nino
    Once more, Billy seems incapable of basic graph reading. On his graph, the decrease is more like 0.3 million, over the span of a week. As flac...
    Post by: mamooth, Aug 10, 2015 in forum: Environment

  16. Post
    Antarctic ice shelf thinning accelerates
    You didn't provide any data from NOAA. You provided a mystery graph that somebody slapped a "NOAA" title on, and which also claimed OLR data was...
    Post by: mamooth, Apr 13, 2015 in forum: Environment

  17. Post
    NOAAGate-"Ocean Acidification a huge con!!"
    Here's the actual NOAA global temperature data graph, from the NOAA website. It looks absolutely nothing like Billy's graph that supposedly came...
    Post by: mamooth, Jan 12, 2015 in forum: Environment

  18. Post
    Climate Change Deniers Are Lying
    Goddard's fudged graph again? It's kind of insulting that Kosh won't even expend the energy to repeat some new frauds. Arctic sea ice extent...
    Post by: mamooth, Jul 3, 2015 in forum: Environment

  19. Post
    IPCC Sea Level Rise Estimates
    ...say. Dogs are howling in pain from your high-frequency hysterics. And reposting a debunked fudged graph just makes you look like a pathological...
    Post by: mamooth, Oct 8, 2014 in forum: Environment

  20. Post
    Arctic sea ice hits record low
    ... Naturally, Ian will deny the data, being the graph came from SS. His obsessive vendetta against SS is his standard excuse to deny any...
    Post by: mamooth, Mar 20, 2015 in forum: Environment
[/URL]
[/LIST]
 
It would be interesting to see a maturity graph of sea surface temps over the last few decades. The Pooh flinging monkey says that they have not been adjusted to cool the past warm the present and smooth out inconvenient bumps. I believe they have.


Well I've asked Mammy to go find a chart of the HISTORY of ocean corrections.. THat's probably not gonna happen. The USHCN (being a Reference system and all that) is somewhat more visible.

If you can't SHOW it.. You can't CLAIM it..
 
jc, this thread is not about your various obsessive personal vendettas. So just stop. Oh, also understand how you've taken the bait and are being reeled in, should you choose to continue. I can tell you that, knowing you'll still fall for it.

I just can't get the deniers to face up to the very basic fallacy of their crazy claims. They're way too emotionally invested in being totally wrong. For example, the "maturity" of a sea temp adjustments doesn't mean anything, yet flac and Ian still obsess about it. Why? Because they desperately need some kind of red herring to deflect from the fact that their conspiracy theory is a big steaming pile.
 
As Goddard hasn't looked at oceans, I don't think there is a fraudulent analysis of them. So no, you won't find an analysis that matches.

You're claiming that all Ocean corrections are DOWNWARD. Only way to show that with same type of analysis that Goddard did on the land data. You DON'T HAVE IT?

Cant' FIND IT? Hey -- maybe it doesn't exist eh??

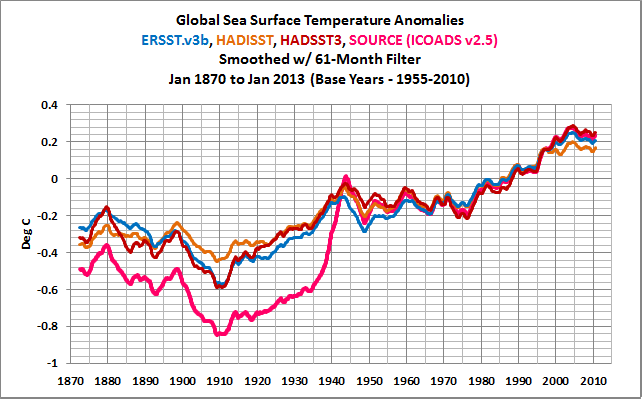
These are SEA surface temperatures -- NOT ATMOSPHERIC TEMPERATURES..And all that jazz about buckets versus canvas readings do NOT apply to GLOBAL AIR surface temperatures. But I don't see any DOWN corrections here either.. For reference -- ICOADS is as close as you get to raw sea water temperatures.


figure-14.png


Now sea WATER temps probably DO NEED corrections for the pre-1940s dates and I'm not concerned.

So show me the AIR temperature corrections for the oceans all being DOWN...
 
Not that I wish to sway from the OP, but what exactly is my supposed vendetta?

To find the truth? yep then you're correct, any other piece of information you wish to share?

BTW, the list was given for the graph that was asked for, can you give me which post it was in?

Again, your claim, not mine or any other, is that the adjustments are in favor of showing cooler temperatures and Not what is happening based on the OP.

we're waiting?
 
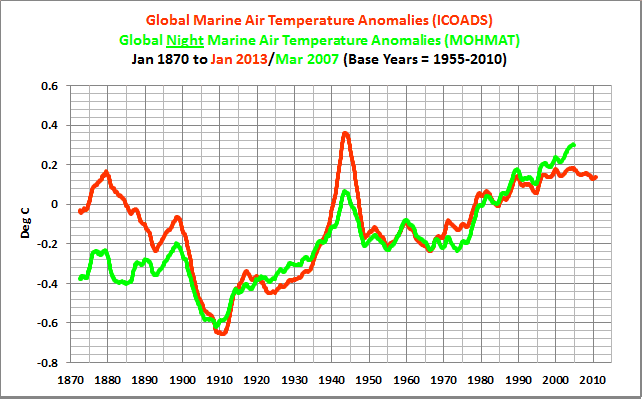
CLOSER to historical RAW data for Marine AIR Temps.. .

figure-16.png


Still no adjustments from where they matter. Like the NOAA or Hadley CRU kitchens....
What I see here is a big DOWN for the 40s and an increasing divergence for current temps UP.

Sound familar??
 
CLOSER to historical RAW data for Marine AIR Temps.. .

figure-16.png


Still no adjustments from where they matter. Like the NOAA or Hadley CRU kitchens....
What I see here is a big DOWN for the 40s and an increasing divergence for current temps UP.

Sound familar??
you know, I bet the probability that all adjustments are all one way, as has been shard in the forum, are astronomical. Wow it's amazing, it's what they found.

It's DOWN in the 40s and UP in the 21st century.. That's what is required to accentuate the warming.. Hockey stick style..
And apparently -- the 50s and 60s -- when everyone was stoned and sex distracted -- have no NEED for corrections. Because THAT record is naturally accurate.. :eusa_shhh:
 
CLOSER to historical RAW data for Marine AIR Temps.. .

figure-16.png


Still no adjustments from where they matter. Like the NOAA or Hadley CRU kitchens....
What I see here is a big DOWN for the 40s and an increasing divergence for current temps UP.

Sound familar??
you know, I bet the probability that all adjustments are all one way, as has been shard in the forum, are astronomical. Wow it's amazing, it's what they found.

It's DOWN in the 40s and UP in the 21st century.. That's what is required to accentuate the warming..
And apparently -- the 50s and 60s -- when everyone was stoned and sex distracted -- have no NEED for corrections. Because THAT record is naturally accurate.. :eusa_shhh:
Funny stuff, so again, the direction is all one way. Cooler in the past and warmer in the current to make that there old linear graph, well, linear.
 
So flac demonstrates that the ocean temps have been corrected to make the warming look smaller, just as I've been saying. Thus, I can't figure out where his conspiracy comes from, or where it's trying to go.

jc, you claim to understand what's going on. So, in your own words, tell us what flac is trying to say. If you're not just playing yes-man, that should be no problem for you.
which graph are you referring to. I'd be glad to comment, but you didn't give any reference. Please provide and I'll be happy to give you my thoughts.
 
BTW, the list was given for the graph that was asked for, can you give me which post it was in?

Post 89 and 91, obviously. Tell us what flac's theory is, in your own words.

And as far as my graphs go, we need to make a deal first.

If I post 'em, you have to leave the board for a month.

If I don't, I'll leave the board for a month.

Deal?

Since you've sworn I've never posted such graphs, you ought be willing to back up your accusation and make that deal. Easy way to get rid of me for a month, right?

Of course, if you're having second thoughts now and need a way to back down, we'll understand. Just say you were mistaken, and we'll leave it at that.
no deal, if you actually posted a graph that verified what your statement read back in a previous post, I'll leave for a week. But, if you didn't actually post a graph, that you stated you did in a previous post, you leave a week.

DEAL?
 
Last edited:
BTW, the list was given for the graph that was asked for, can you give me which post it was in?

Post 89 and 91, obviously. Tell us what flac's theory is, in your own words.

And as far as my graphs go, we need to make a deal first.

If I post 'em, you have to leave the board for a month.

If I don't, I'll leave the board for a month.

Deal?

Since you've sworn I've never posted such graphs, you ought be willing to back up your accusation and make that deal. Easy way to get rid of me for a month, right?

Of course, if you're having second thoughts now and need a way to back down, we'll understand. Just say you were mistaken, and we'll leave it at that.
So, I'm still confused with your reference posts 89 and 91. What did he disagree with? I don't think either graph had an error if I read his posts correctly. he was showing what they ought to look like. I'm just saying.
 
He has a theory as to how the ocean temperature adjustments prove something nefarious, but I can't figure out what that something is. As I've been saying, the ocean temperature adjustments make the total warming look smaller, and that's all you need to know for purposes of disproving the grand conspiracy.

And that's what you keep asking me to show the graph of. Again. So here's one example. May 2015. You were participating in the thread. Have a nice vacation.

Cooling The Past In The Faroes | Page 2 | US Message Board - Political Discussion Forum
 

Forum List

Back
Top