Did Bush cause 2008 the Financial Crisis?

I provided the link, you merely pontificated.

Stick to something you can back up!

I have done it for a living for over 23 years...

The program the NYT article refers to was not a popular product when at the time you could get a Zero Down FHA DPA loan at basically the same rate...

Nehemiah was the primary Non Profit at the time where the down payment and closing cost came from the seller via rolling it into the price, a nice little loop hole Clinton devised in late '96 and rolled it out in early '97. He revised CRA to help accommodate this product...

In essence the borrower was out anywhere from as little as $150 to as much as $800...

Not a bad risk for the buyer...

The lowest score I saw under FHA DPA was a 517 FICO that closed for about a $650 total investment on a 20 Year FHA DPA loan...

Today the hot loan for less than stellar financials is USDA, Zero Down, low MI and income caps are very liberal...

The Sub Prime market started as a 20% to 30% down payment with usually a 4% bump above par. Down the road Sub Prime was transformed into Zero Down, no MI, no escrows that you could easily get done with a 560 to 580 FICO...

If you don't believe me I could care less, take it or leave it Ed...

Back to PAPER Approval reality...
As of 2006 through September 2008, janitor earning 20K/year gets a call from a Mortgage Broker telling said janitor that he has been approved for a 30 year, 6.5%, 600K Loan.
And please don't respond with a fairy tale that this wasn't happening by the hundreds of thousands.

It wasn't and that is no fairy tale...

Look it up, the internet is free and you will not find anything factual that supports those numbers on the scale you propose...

Loans like this did take place, but not in to hundreds of thousands as you claim...

The facts do not support it...

Good hyperbole though...
 
I provided the link, you merely pontificated.

Stick to something you can back up!

I have done it for a living for over 23 years...

The program the NYT article refers to was not a popular product when at the time you could get a Zero Down FHA DPA loan at basically the same rate...

Nehemiah was the primary Non Profit at the time where the down payment and closing cost came from the seller via rolling it into the price, a nice little loop hole Clinton devised in late '96 and rolled it out in early '97. He revised CRA to help accommodate this product...

In essence the borrower was out anywhere from as little as $150 to as much as $800...

Not a bad risk for the buyer...

The lowest score I saw under FHA DPA was a 517 FICO that closed for about a $650 total investment on a 20 Year FHA DPA loan...

Today the hot loan for less than stellar financials is USDA, Zero Down, low MI and income caps are very liberal...

The Sub Prime market started as a 20% to 30% down payment with usually a 4% bump above par. Down the road Sub Prime was transformed into Zero Down, no MI, no escrows that you could easily get done with a 560 to 580 FICO...

If you don't believe me I could care less, take it or leave it Ed...
So no link and just more pontification.

I'll leave it!

Good...

Now STFU...
 
Bush at the end of 2000 the average for the year was 131,785,000 fully employed...
At the end of 2008 the average for the year was 136,790,000 full employed and THAT is A FACT!
That means from end of 2000 to the end of 2008 there were 5,050,000 more employed!
These are exactly what the Bureau of Labor Statistics REPORTED.
First of all, Bush was not president for any part of 2000. Second, an average does not tell you what is going on at the end of a year. And thirdly the number employed does not give the full picture of the overall employment situation, you also need to look at the change in the number of Unemployed over the period.

Here are the honest numbers:
132,694,000 total full employed Clinton's last month in office.
133,976,000 total full employed Bush's last month in office.

An increase of 1,282,000

6,023,000 unemployed Clinton's last month in office.
12,058,000 unemployed Bush's last month in office.

An increase of 6,035,000.

That is a net job loss of 5,753,000.

HEY NOTICE any difference between what you wrote and what I wrote???
I PROVIDED FACTS... where are you f...king facts!!

So let's look at the END of 2000.. employed people because was NOT PRESIDENT in 2000 RIGHT?
http://www.citizen.org/documents/Historical_employment_data.pdf


View attachment 30267
LOOK AT the
2000...................131,785,000
Now look at the end of 2008.
2008...................136,790,000

136,790,000
-131,785,000
5,005,000 MORE PEOPLE Working at the end of 2008 then at the beginning of 2001!
F-K case closed you dummy!

NOW ANSWER me you dumb f...k!
Who the F**K are you to call ANYONE on Earth a dummy?!!! Your attachment clearly is labeled as a yearly AVERAGE so it is worthless for beginning or ending numbers. :asshole:

You are too stupid to tell an yearly AVERAGE from a beginning or ending MONTH! :asshole:

Here is the link to the numbers I posted. You are probably too stupid to figure what boxes to check to get the monthly data I posted. :asshole:

Table B-1. Employees on nonfarm payrolls by industry sector and selected industry detail [In thousands]
 
I have done it for a living for over 23 years...

The program the NYT article refers to was not a popular product when at the time you could get a Zero Down FHA DPA loan at basically the same rate...

Nehemiah was the primary Non Profit at the time where the down payment and closing cost came from the seller via rolling it into the price, a nice little loop hole Clinton devised in late '96 and rolled it out in early '97. He revised CRA to help accommodate this product...

In essence the borrower was out anywhere from as little as $150 to as much as $800...

Not a bad risk for the buyer...

The lowest score I saw under FHA DPA was a 517 FICO that closed for about a $650 total investment on a 20 Year FHA DPA loan...

Today the hot loan for less than stellar financials is USDA, Zero Down, low MI and income caps are very liberal...

The Sub Prime market started as a 20% to 30% down payment with usually a 4% bump above par. Down the road Sub Prime was transformed into Zero Down, no MI, no escrows that you could easily get done with a 560 to 580 FICO...

If you don't believe me I could care less, take it or leave it Ed...
So no link and just more pontification.

I'll leave it!

Good...

Now STFU...

NO! :asshole:
 
Not exclusively. Reagan, Bush Sr, Clinton, and Bush Jr all had a hand in it, as the problems that caused the financial crisis compounded over decades.
And you can add Obama to the list. Every one of them has ridden to Office on money supplied by the corporatocracy and the finance industries. With the recent de-regulation, outstandingly the Citizens United abomination, we can only expect things to get worse -- unless the voting public can be educated as to the vital necessity of moving toward socialist leadership.

Those who understand the need for such a radical political transition will support Senator Bernie Sanders if he decides to run. Because he presently is America's only hope to avoid becoming a plutocracy.
 
I looked through this entire article and NOT one mention that George W Bush single-handedly caused the crisis as many Bush bashers believe!

And while GWB was NOT single-handedly blamed as MOST unintelligent UNINFORMED idiots would have you believe..
Here are the Presidents that share the blame.
[Personal note: Unlike many of the posters here I am intellectually honest to include GOP as part of the blame... Yes GWB included!]

These people were appointed by US Presidents including Reagan, Bush Senior, Clinton, Bush and Obama to top government positions, in part as a payback for campaign contribution by some of these Wall Street firms.

Who contributed to the creation to the financial crisis and the ensuing economic crisis?
The following is a general answer followed by a section naming the key players:

Regulators who relaxed risk management regulations required by the banks and for not regulating derivative investments (please, see more specific details below)
The Federal Reserve Chairmen who dismissed the build-up of the housing bubble from 2002 to 2007 until it was too late. They did not take actions to regulate mortgage companies or control the housing bubble

World Central Bankers who blindly copied the US Federal Reserve Bank policies

World Financial Regulators who blindly copied US financial market models and regulations

World Investment Banks who sold subprime (high risk) mortgage backed securities to their customers without fully understanding them and who hired credit rating agencies to rate them as high quality investment when in fact they included high risk loans. The same banks who sold the subprime investments later bet against their own clients without disclosing the conflict of interest to their clients

Credit Rating Agencies who overrated junk securities as investment-grade quality and misled investors about the risk and the value of these investments

Academic and Financial Economists who ignored the warnings and misjudged macroeconomic and financial market indicators

Award-winning Economists who designed flawed risk pricing models

Investment Analysts who used flawed risk pricing models and asset portfolio theories

Wall Street Banking Executives who ignored internal risk management policies out of greed to increase revenues and their bonuses in the short term at the expense of long term stability of their companies

Wall Street Boards of Directors who did not protect their shareholders against excessive executive compensation and ignored prudent risk management strategies
Wall Street Advisors who did not do their homework before advising their clients on bad investments

Investment Fund Managers who lost billions of dollars investing without adequate due diligence

Mortgage Brokers who sold loans to unqualified borrowers in order to collect more commissions

Homebuyers who took loans they could not afford to pay back and blamed the banks for predatory lending

US Presidents for hiring former Wall Street lobbyists as government policy makers who bailed out the banks without regard to the moral hazard. By doing so, they shifted the burden on the taxpayers and risked the future of the national economy

US Supreme Court Justices who ruled that the government may not ban political spending by corporations in candidate elections thus tightening the grip of Wall Street on government officials and skewing the balance of power in favor of Wall Street and big companies.

The Financial Media who took no responsibility for promoting the illusions of a healthy housing sector and for not asking the right questions. Media outlets that favored a promotional business model at the expense of investigative journalism. In our research, we found a prevalent bias in allocating airwaves and print space to brand name experts. Most journalists and editors seem to ignore voices that are not well-known or those who have a story that do not fit their narrative or preconception. All we had to do is Google simple phrases like "US Economic Risks" to find a wealth of information that would raise so many critical questions. If equal media exposure was given to the voices that warned us about the housing bubble, the damage could have been mitigated.


Who is to Blame for the Financial Crisis and Ensuing Economic Crisis

Yes, indeed.


....the world crisis was caused by Bush’s "profligate spending" and dangerous tax cuts at a time when the US was spending nearly $1 trillion on the wars in Afghanistan and Iraq....

.
 
First of all, Bush was not president for any part of 2000. Second, an average does not tell you what is going on at the end of a year. And thirdly the number employed does not give the full picture of the overall employment situation, you also need to look at the change in the number of Unemployed over the period.

Here are the honest numbers:
132,694,000 total full employed Clinton's last month in office.
133,976,000 total full employed Bush's last month in office.

An increase of 1,282,000

6,023,000 unemployed Clinton's last month in office.
12,058,000 unemployed Bush's last month in office.

An increase of 6,035,000.

That is a net job loss of 5,753,000.

HEY NOTICE any difference between what you wrote and what I wrote???
I PROVIDED FACTS... where are you f...king facts!!

So let's look at the END of 2000.. employed people because was NOT PRESIDENT in 2000 RIGHT?
http://www.citizen.org/documents/Historical_employment_data.pdf


View attachment 30267
LOOK AT the
2000...................131,785,000
Now look at the end of 2008.
2008...................136,790,000

136,790,000
-131,785,000
5,005,000 MORE PEOPLE Working at the end of 2008 then at the beginning of 2001!
F-K case closed you dummy!

NOW ANSWER me you dumb f...k!
Who the F**K are you to call ANYONE on Earth a dummy?!!! Your attachment clearly is labeled as a yearly AVERAGE so it is worthless for beginning or ending numbers. :asshole:

You are too stupid to tell an yearly AVERAGE from a beginning or ending MONTH! :asshole:

Here is the link to the numbers I posted. You are probably too stupid to figure what boxes to check to get the monthly data I posted. :asshole:

Table B-1. Employees on nonfarm payrolls by industry sector and selected industry detail [In thousands]


OK remedial math:
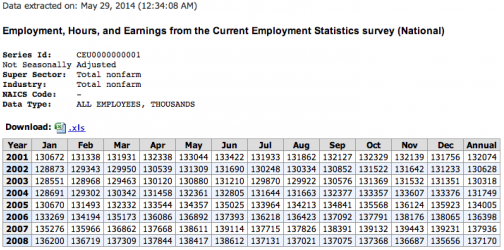
Beginning of 2001 130,672,000
at the End of 2008 135,656,000
The difference when you subtract from 135,656,000 for DEC 2008
the JAN 2001 figure of 130,672,000..
4,984,000 MORE people working at the END of 2008 then at the beginning of 2001!
So let see just so you are clear..
The data comes directly from the Notice: Data not available: U.S. Bureau of Labor Statistics
And it looks like this:

$Screen Shot 2014-05-28 at 11.39.00 PM.png

Averages, etc... here are the facts... NO where NEAR your total fabrication or GUESSES!
 
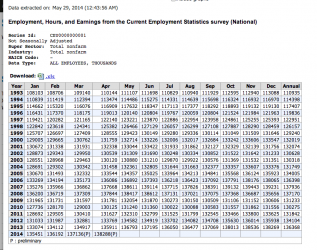
NOW let's LOOK AT REALITY!!!

$Screen Shot 2014-05-28 at 11.44.10 PM.png


Clinton HAD NOTHING but good economy and HE SCREWED that up..
Started Jan 1993 108,103,000
ended Dec 2000 133,547,000
Pretty good jobs.. 25,444,000...
BUT he left us with a Dot.com bust and a recession..
So in 2001 in spite of July loss of 1,489,000 REMEMBER DOT.COM???
Aug 2001 job loss of 71,000, then sep 2001 picked up added 265,000..
Oct 2001 added 202,000, Nov 2001 12,000 lost (first of 9/11 remember???)
Dec 2001 383,000 lost jobs.. beginning feel 9/11!
Jan 2002 2,883,000 Lost NOW full effects of 9/11..
Feb 2002 470,000 GAIN..
and from that point to Dec 2002 there were gains every month over--1,692,000 added.
From February 2003 to Dec 2007 a gain of over 10,263,000 jobs...
All in spite of worst hurricane SEASONS in history...
Then the bottom fell out..
From the largest number of employed in history 139,231,000 the housing bubble broke.
end of 2008 135,656,000 a loss of 3,575,000.
The highest number of employed still hasn't been beaten 139,231,000!
 
HEY NOTICE any difference between what you wrote and what I wrote???
I PROVIDED FACTS... where are you f...king facts!!

So let's look at the END of 2000.. employed people because was NOT PRESIDENT in 2000 RIGHT?
http://www.citizen.org/documents/Historical_employment_data.pdf


View attachment 30267
LOOK AT the
2000...................131,785,000
Now look at the end of 2008.
2008...................136,790,000

136,790,000
-131,785,000
5,005,000 MORE PEOPLE Working at the end of 2008 then at the beginning of 2001!
F-K case closed you dummy!

NOW ANSWER me you dumb f...k!
Who the F**K are you to call ANYONE on Earth a dummy?!!! Your attachment clearly is labeled as a yearly AVERAGE so it is worthless for beginning or ending numbers. :asshole:

You are too stupid to tell an yearly AVERAGE from a beginning or ending MONTH! :asshole:

Here is the link to the numbers I posted. You are probably too stupid to figure what boxes to check to get the monthly data I posted. :asshole:

Table B-1. Employees on nonfarm payrolls by industry sector and selected industry detail [In thousands]


OK remedial math:
Beginning of 2001 130,672,000
at the End of 2008 135,656,000
The difference when you subtract from 135,656,000 for DEC 2008
the JAN 2001 figure of 130,672,000..
4,984,000 MORE people working at the END of 2008 then at the beginning of 2001!
So let see just so you are clear..
The data comes directly from the Notice: Data not available: U.S. Bureau of Labor Statistics
And it looks like this:

View attachment 30268

Averages, etc... here are the facts... NO where NEAR your total fabrication or GUESSES!
Bush's last month was NOT Dec 2008, it was Jan 2009 and he left, using your unadjusted numbers, with 131,965,000 employed.

The difference when you subtract the honest numbers Jan 2001 from Jan 2009 you get 1,293,000.

That's 1,293,000 jobs created in 8 FULL years, not your dishonest 7 years and 11 months.

But you also have to look at jobs LOST where Bush increased the number of unemployed by 6,035,000 jobs, so Bush has the distinction of loosing more jobs than he created!!!!!
 
Last edited:
NOW let's LOOK AT REALITY!!!

View attachment 30269


Clinton HAD NOTHING but good economy and HE SCREWED that up..
Started Jan 1993 108,103,000
ended Dec 2000 133,547,000
Pretty good jobs.. 25,444,000...
BUT he left us with a Dot.com bust and a recession..
So in 2001 in spite of July loss of 1,489,000 REMEMBER DOT.COM???
Aug 2001 job loss of 71,000, then sep 2001 picked up added 265,000..
Oct 2001 added 202,000, Nov 2001 12,000 lost (first of 9/11 remember???)
Dec 2001 383,000 lost jobs.. beginning feel 9/11!
Jan 2002 2,883,000 Lost NOW full effects of 9/11..
Feb 2002 470,000 GAIN..
and from that point to Dec 2002 there were gains every month over--1,692,000 added.
From February 2003 to Dec 2007 a gain of over 10,263,000 jobs...
All in spite of worst hurricane SEASONS in history...
Then the bottom fell out..
From the largest number of employed in history 139,231,000 the housing bubble broke.
end of 2008 135,656,000 a loss of 3,575,000.
The highest number of employed still hasn't been beaten 139,231,000!
Hey dumbass, you are using the non seasonally adjusted numbers, so the Jan loss had almost nothing to do with Bush allowing America to be attacked by terrorists on 9/11, but the typical Christmas season lay off, that is why honest people use the seasonally adjusted numbers. Just further proof the Right starts with a premise and then dishonestly juggles any numbers to fit.
 
Last edited:
Only BOOOOSH put in corrupt greedy idiot "regulators" who allowed his pals in private firms to rate toxic mortgages/assets as A+, then bundle, insure, and sell them around the world. Fannie and Freddies's share of the market fell from 75-80% of the market to 25% from 2003-6. Great job, greedy idiot Pubs and of course their ignorant brainwashed hater dupes...
 

Forum List

Back
Top