flacaltenn
Diamond Member
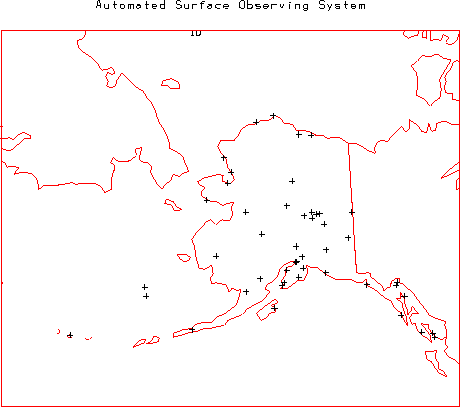
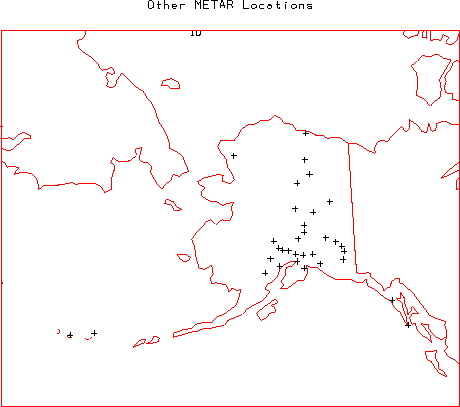
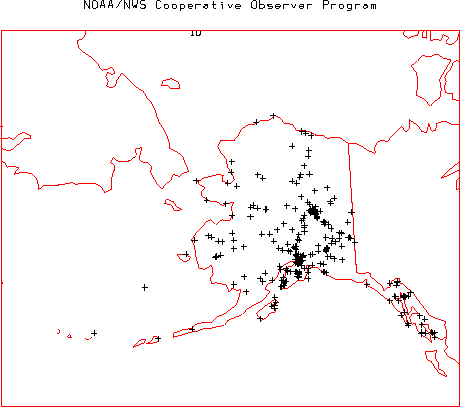
Rather than argue with statistics lets simply talk about how global warming is said to be occurring by our own actions. The burning of fossil fuels and massive amounts of carbon emissions being released into the atmosphere right?Here we go again. The proven ignoramouses insisting that 2% of the Earth's surface record is more important than the other 98%. And, if you include Alaska's record in that, rather than just the lower 48, you will see that the whole of the US is also warming, on the average.
You seem to be very informed on the subject so tell me what do you think are the primary direct and indirect consequences of this specific event?
CO2 does have power to warm the surface. What it DOESN'T HAVE is the superpowers attributed to it by the GWarming theory. According the theory -- man's emissions are just the "TRIGGER" that will set off a chain of events (positive feedbacks, runaway GreenHouse effect, Hollywood scale destruction and mayhem) that will cause the planet to commit suicide. All of the nasty world-ending stuff you've been fed --- man emitted CO2 by itself cannot do.
HOW MUCH warming to expect from man-made CO2 emissions? Basic science (based on the warming power of CO2 by ITSELF) is about 1degC/doubling. So you go from 280ppm CO2 in pre-industrial age to 560ppm sometime in the future and you get 1degC warmer.
Global Warming theory however started out circa 1980 or so predicting 4 or 8 degC by 2100 and up to 11degC in the Northern Lattitudes. Hence the frightening of the masses and the political involvement.
NONE of those early projections still stand. But the POLITICAL AMBITION to keep the hysteria going is strong..