Deceptive temperature record claims

Freewill

Platinum Member
Oct 26, 2011
31,158
5,072
1,130
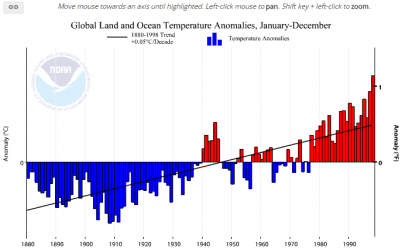
This is why the US average temperature has shown no warming for the last several years although the global temperatures continue on the same increase. At least the temperature anomaly does.

Don't believe me, go here: Climate at a Glance | National Centers for Environmental Information (NCEI)


Deceptive temperature record claims


TOM HARRIS: Global warming: Deceptive temperature record claims - Washington Times

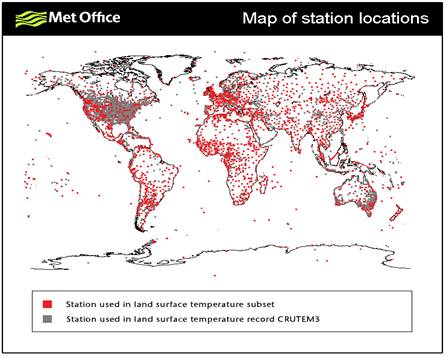
They also know that calculating so-called global average temperatures to hundredths of a degree is irrational. After all, there is very little data for the 70 percent of Earth’s surface that is ocean. There is also little data for mountainous and desert regions, not to mention the Antarctic. Much of the coverage is so sparse that NASA is forced to make the ridiculous claim that regions are adequately covered if there is a temperature-sensing station within nearly 750 miles. This is the distance between Ottawa, Canada, and Myrtle Beach, S.C. cities with very different climates. Yet, according to NASA, only one temperature sensing station is necessary for the two cities and the vast area between them to be adequately represented in their network.
 
Are you suggesting that the temperatures between those sparsely sampled areas are all colder than the sampled points?

And when you use the term "deceptive", are you really trying to say that the climate scientists involved are intentionally producing erroneous data by... what? Preventing more stations from being erected in Antarctica? By holding back the number of ARGO buoys? By limiting the number of satellites observing Earth's conditions?

Who do you believe is being deceptive and how?

Here is what I suggest. Go to the link I provided, it is from NOAA. Do a time line from say 1998 until 2015 and make it annual. Do that for US average temperature and global temperature anomaly. You will see that the US shows cooling while the global anomaly indicates warming. If you do the same from the say 1900 to 1998 you will see that both tracked together, then the US started to deviate? Why?
 
Here I did it for you all. Note that the temperature anomally for Global never really changes from 1895 to 2015, the slope of the line is nearly the same, about .1 dg C /decade. Which is the slope of the line for US average temperatues for the same period.

But look at the difference past 1998, US trends down, the Globe continues on it way up.

The question is why and which do we trust/? Reading taken over large areas and then compared to an anomaly? Or actual average temperature for a very well read area?

upload_2015-8-24_8-31-20.png


upload_2015-8-24_8-32-42.png


upload_2015-8-24_8-35-24.png


upload_2015-8-24_8-36-33.png
 

Attachments

  • upload_2015-8-24_8-34-1.png
    upload_2015-8-24_8-34-1.png
    11 KB · Views: 85
[

Here is what I suggest. Go to the link I provided, it is from NOAA. Do a time line from say 1998 until 2015 and make it annual. Do that for US average temperature and global temperature anomaly. You will see that the US shows cooling while the global anomaly indicates warming. If you do the same from the say 1900 to 1998 you will see that both tracked together, then the US started to deviate? Why?

Polar vortex.
 
If you thought it was easy to fudge numbers before, now that the AGWCult magically added in the "Excess heat absorbed by the ocean all the way down to the deepest abyss" why they can ALWAYS show "Warming" no matter how long the surface pause continues
 
[

Here is what I suggest. Go to the link I provided, it is from NOAA. Do a time line from say 1998 until 2015 and make it annual. Do that for US average temperature and global temperature anomaly. You will see that the US shows cooling while the global anomaly indicates warming. If you do the same from the say 1900 to 1998 you will see that both tracked together, then the US started to deviate? Why?

Polar vortex.
 
Here we go again. The proven ignoramouses insisting that 2% of the Earth's surface record is more important than the other 98%. And, if you include Alaska's record in that, rather than just the lower 48, you will see that the whole of the US is also warming, on the average.
 
Here we go again. The proven ignoramouses insisting that 2% of the Earth's surface record is more important than the other 98%. And, if you include Alaska's record in that, rather than just the lower 48, you will see that the whole of the US is also warming, on the average.

I proved what I said, where is your proof?
 
The Alaska Climate Research Center

Temperature Changes in Alaska

The topic of climate change has attracted widespread attention in recent years and is an issue that numerous scientists study on various time and space scales. One thing for sure is that the earth's climate has and will continue to change as a result of various natural and anthropogenic forcing mechanisms.

This page features the trends in mean annual and seasonal temperatures for Alaska's first-order observing stations since 1949, the time period for which the most reliable meteorological data are available. The temperature change varies from one climatic zone to another as well as for different seasons. If a linear trend is taken through mean annual temperatures, the average change over the last 6 decades is 3.0°F. However, when analyzing the trends for the four seasons, it can be seen that most of the change has occurred in winter and spring, with the least amount of change in autumn.

Considering just a linear trend can mask some important variability characteristics in the time series. The figure at right shows clearly that this trend is non-linear: a linear trend might have been expected from the fairly steady observed increase of CO2 during this time period. The figure shows the temperature departure from the long-term mean (1949-2009) for all stations. It can be seen that there are large variations from year to year and the 5-year moving average demonstrates large increase in 1976. The period 1949 to 1975 was substantially colder than the period from 1977 to 2009, however since 1977 little additional warming has occurred in Alaska with the exception of Barrow and a few other locations. The stepwise shift appearing in the temperature data in 1976 corresponds to a phase shift of the Pacific Decadal Oscillation from a negative phase to a positive phase. Synoptic conditions with the positive phase tend to consist of increased southerly flow and warm air advection into Alaska during the winter, resulting in positive temperature anomalies.

Temperature Changes in Alaska Figures


You may view charts of temperature climate trends by location here.

 
A while back I stumbled upon a paper that measured the UHI effect at Barrow Alaska. It found a difference of well over 2C in the two years it was measured. In a town of only a few thousand people.

Likewise many of the stations in the Arctic are contaminated by UHI, and then smeared around to areas within hundreds of kilometers, and often over a thousand kms.

I don't know what the solution is, but Arctic stations and infills need to be taken with a grain of salt.
 
The Alaska Climate Research Center

Temperature Changes in Alaska

The topic of climate change has attracted widespread attention in recent years and is an issue that numerous scientists study on various time and space scales. One thing for sure is that the earth's climate has and will continue to change as a result of various natural and anthropogenic forcing mechanisms.

This page features the trends in mean annual and seasonal temperatures for Alaska's first-order observing stations since 1949, the time period for which the most reliable meteorological data are available. The temperature change varies from one climatic zone to another as well as for different seasons. If a linear trend is taken through mean annual temperatures, the average change over the last 6 decades is 3.0°F. However, when analyzing the trends for the four seasons, it can be seen that most of the change has occurred in winter and spring, with the least amount of change in autumn.

Considering just a linear trend can mask some important variability characteristics in the time series. The figure at right shows clearly that this trend is non-linear: a linear trend might have been expected from the fairly steady observed increase of CO2 during this time period. The figure shows the temperature departure from the long-term mean (1949-2009) for all stations. It can be seen that there are large variations from year to year and the 5-year moving average demonstrates large increase in 1976. The period 1949 to 1975 was substantially colder than the period from 1977 to 2009, however since 1977 little additional warming has occurred in Alaska with the exception of Barrow and a few other locations. The stepwise shift appearing in the temperature data in 1976 corresponds to a phase shift of the Pacific Decadal Oscillation from a negative phase to a positive phase. Synoptic conditions with the positive phase tend to consist of increased southerly flow and warm air advection into Alaska during the winter, resulting in positive temperature anomalies.

Temperature Changes in Alaska Figures


You may view charts of temperature climate trends by location here.


So glad you brought up Alaska GoldiRocks. Because the individual station data in Alaska from NASA GISS suffers more from "hockey stick" adjustments than the lower 48.. You also need to look at the map below and realize HOW BIG alaska is...

image002.jpg


Hell -- 80% of the reporting stations are in the lower 1/2 of the state. That means that there are damn few colder stations at the North coast. Everything IN BETWEEN is invented data. You might as well ASSUME a warming for the state and just fill in the blanks. That missing data is at EXTREME elevation and weather differences.

How accurate you think that shit is compared to Tennessee?? And more importantly if this crappy coverage is DIVERGING from the satellite readings -- why would EVER believe that this 19th century version of reading Earth temperature is the better reading?
 
You stumbled upon a paper, but cannot link us to it here? And we are to consider that evidence?

Don't act so helpless Rocks. Finding this stuff is about as hard as 5th grade book report.

The urban heat island in winter at Barrow, Alaska - Hinkel - 2003 - International Journal of Climatology - Wiley Online Library

Abstract
The village of Barrow, Alaska, is the northernmost settlement in the USA and the largest native community in the Arctic. The population has grown from about 300 residents in 1900 to more than 4600 in 2000. In recent decades, a general increase of mean annual and mean winter air temperature has been recorded near the centre of the village, and a concurrent trend of progressively earlier snowmelt in the village has been documented. Satellite observations and data from a nearby climate observatory indicate a corresponding but much weaker snowmelt trend in the surrounding regions of relatively undisturbed tundra. Because the region is underlain by ice-rich permafrost, there is concern that early snowmelt will increase the thickness of the thawed layer in summer and threaten the structural stability of roads, buildings, and pipelines. Here, we demonstrate the existence of a strong urban heat island (UHI) during winter. Data loggers (54) were installed in the ∼150 km2 study area to monitor hourly air and soil temperature, and daily spatial averages were calculated using the six or seven warmest and coldest sites. During winter (December 2001–March 2002), the urban area averaged 2.2 °C warmer than the hinterland. The strength of the UHI increased as the wind velocity decreased, reaching an average value of 3.2 °C under calm (<2 m s−1) conditions and maximum single-day magnitude of 6 °C. UHI magnitude generally increased with decreasing air temperature in winter, reflecting the input of anthropogenic heat to maintain interior building temperatures. On a daily basis, the UHI reached its peak intensity in the late evening and early morning. There was a strong positive relation between monthly UHI magnitude and natural gas production/use. Integrated over the period September–May, there was a 9% reduction in accumulated freezing degree days in the urban area. The evidence suggests that urbanization has contributed to early snowmelt in the village. Copyright © 2003 Royal Meteorological Society

Now do understand why Hadley data should go DOWN not UP with Urban HeatIsland compensation?
So much screwing around --- it's not funny... Sorry Ian for butting in... I had the 20 seconds to kill by googling "urban heat island" and "barrow alaska".. :booze:
 
Permafrost Degradation and Ecological Changes Associated with a WarmingClimate in Central Alaska - Springer

Abstract

Studies from 1994–1998 on the TananaFlats in central Alaska reveal that permafrostdegradation is widespread and rapid, causing largeshifts in ecosystems from birch forests to fens andbogs. Fine-grained soils under the birch forest areice-rich and thaw settlement typically is 1–2.5 mafter the permafrost thaws. The collapsed areas arerapidly colonized by aquatic herbaceous plants,leading to the development of a thick, floatingorganic mat. Based on field sampling of soils,permafrost and vegetation, and the construction of aGIS database, we estimate that 17% of the study area(263,964 ha) is unfrozen with no previous permafrost,48% has stable permafrost, 31% is partiallydegraded, and 4% has totally degraded. For thatportion that currently has, or recently had,permafrost (83% of area), ∼42% has been affected bythermokarst development. Based on airphoto analysis,birch forests have decreased 35% and fens haveincreased 29% from 1949 to 1995. Overall, the areawith totally degraded permafrost (collapse-scar fensand bogs) has increased from 39 to 47% in 46 y. Based on rates of change from airphoto analysis andradiocarbon dating, we estimate 83% of thedegradation occurred before 1949. Evidence indicatesthis permafrost degradation began in the mid-1700s andis associated with periods of relatively warm climateduring the mid-late 1700s and 1900s. If currentconditions persist, the remaining lowland birchforests will be eliminated by the end of the nextcentury.

Now permafrost is like ice. It is a very good measure of whether the area is warming or cooling. If it is cooling, the permafrost gets deeper, and has a shorter melt system. If it is warming, the permafrost melts on the top, and does not get deeper, also has a longer melt season. For the area in the study, it is definately getting warmer. In fact, for just about anywhere in Alaska, the permafrost is melting rapidly and actually changing the landscape.

That is pretty solid proof that Alaska is in a major warmup. And you are correct, Alaska is very big. Which means that when you throw in Alaska with the average of the lower 48, the US as a whole is actually warming. Besides which, while the Northeast was pretty cold this winter, the West was very warm, record warm in many places, and continues to be so to the present. I don't think that even the lower 48 record is going to show any cooling in 2015. Maybe not as much warming, if you exclude Alaska, as the rest of the world, but a definate warming.
 
Based on rates of change from airphoto analysis andradiocarbon dating, we estimate 83% of thedegradation occurred before 1949. Evidence indicatesthis permafrost degradation began in the mid-1700s andis associated with periods of relatively warm climateduring the mid-late 1700s and 1900s. If currentconditions persist, the remaining lowland birchforests will be eliminated by the end of the nextcentury.

This is really what I'm TRYING to get you to realize.. The BULK of frozen ground, ocean, calthrates thawed EONS ago.. That "positive feedback" did NOT result in runaway warming. In fact -- the Earth tested that hypothesis 3 or 4 times during the Ice AgeS. What you're watching in your lifetime is like the last of the snowpile at the bottom of your driveway in early March. And yes -- it might melt a little faster without the support of the 18" snowfall that caused the pile to be created.

Don't want you to go to bed angry and sad and scared every night.. 'OK' ??? You want me to leave the light on? :itsok:
 
Last edited:
A while back I stumbled upon a paper that measured the UHI effect at Barrow Alaska. It found a difference of well over 2C in the two years it was measured. In a town of only a few thousand people.

Likewise many of the stations in the Arctic are contaminated by UHI, and then smeared around to areas within hundreds of kilometers, and often over a thousand kms.

I don't know what the solution is, but Arctic stations and infills need to be taken with a grain of salt.

This is one of the major areas that impact global average (along with oceans) which are being given arbitrary numbers to suit the agenda. WE already have the solution for our atmosphere in satellites. It is the ocean that we are not measuring beyond 1 meter in depth accurately.
 
The Alaska Climate Research Center

Temperature Changes in Alaska

The topic of climate change has attracted widespread attention in recent years and is an issue that numerous scientists study on various time and space scales. One thing for sure is that the earth's climate has and will continue to change as a result of various natural and anthropogenic forcing mechanisms.

This page features the trends in mean annual and seasonal temperatures for Alaska's first-order observing stations since 1949, the time period for which the most reliable meteorological data are available. The temperature change varies from one climatic zone to another as well as for different seasons. If a linear trend is taken through mean annual temperatures, the average change over the last 6 decades is 3.0°F. However, when analyzing the trends for the four seasons, it can be seen that most of the change has occurred in winter and spring, with the least amount of change in autumn.

Considering just a linear trend can mask some important variability characteristics in the time series. The figure at right shows clearly that this trend is non-linear: a linear trend might have been expected from the fairly steady observed increase of CO2 during this time period. The figure shows the temperature departure from the long-term mean (1949-2009) for all stations. It can be seen that there are large variations from year to year and the 5-year moving average demonstrates large increase in 1976. The period 1949 to 1975 was substantially colder than the period from 1977 to 2009, however since 1977 little additional warming has occurred in Alaska with the exception of Barrow and a few other locations. The stepwise shift appearing in the temperature data in 1976 corresponds to a phase shift of the Pacific Decadal Oscillation from a negative phase to a positive phase. Synoptic conditions with the positive phase tend to consist of increased southerly flow and warm air advection into Alaska during the winter, resulting in positive temperature anomalies.

Temperature Changes in Alaska Figures


You may view charts of temperature climate trends by location here.


From the same source as your chart:
Seasonal_Yearly_Temp_Change_77_F.png


Looks to me that the winter and spring are colder and more then make up for the increase in the summer and fall. Makes one wonder where they got their info for the first graph, which isn't actually temperature it is a deviation from some derived temperature.
 
If you thought it was easy to fudge numbers before, now that the AGWCult magically added in the "Excess heat absorbed by the ocean all the way down to the deepest abyss" why they can ALWAYS show "Warming" no matter how long the surface pause continues
So the international community can be conspiring to influence politics with regards to global warming but a US agency can't be?

I think a long history of US agency lying to it's citizens should tilt you the other way
 
Here we go again. The proven ignoramouses insisting that 2% of the Earth's surface record is more important than the other 98%. And, if you include Alaska's record in that, rather than just the lower 48, you will see that the whole of the US is also warming, on the average.
Rather than argue with statistics lets simply talk about how global warming is said to be occurring by our own actions. The burning of fossil fuels and massive amounts of carbon emissions being released into the atmosphere right?

You seem to be very informed on the subject so tell me what do you think are the primary direct and indirect consequences of this specific event?
 

Forum List

Back
Top