ScienceRocks
Democrat all the way!
- Banned
- #1
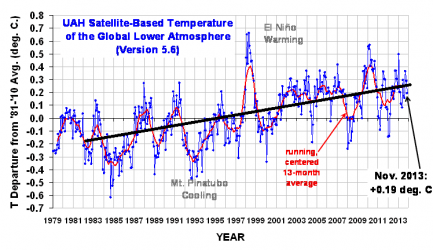
Dec update of the global temperature trend.
My findings...
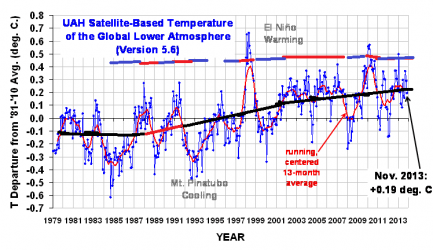
1. I added in from 1998-2013 long term ENSO. This shows 1999-2001 as cold, 2002-2007 warm and 2008-2013 overall cold.
1.1 1998-2013 was + or - long term trend within section 3.4 of the tropical pacific.
2. 1991-1997 was recovering from the eruption of Pinatubo and 1984 is also another such volcano. This gives the appearance of upwards of twice the warming.
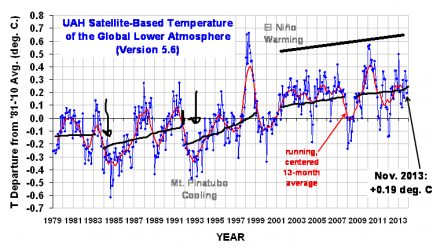
2.1 I used the 1979-1984 before the volcano's in order to give a more accurate trend. Notice how per-eruption is warmer in both cases...This means forcing - volcanic forcing = new forcing. Volcano's negative forcing hasn't caused a long term effect on the trend after 10 years in both cases.
Short term 1-10 year forcings that we recover out of was smoothed over...
My second graph on the right shows the effects of the volcano's rebound.
My findings...
1. I added in from 1998-2013 long term ENSO. This shows 1999-2001 as cold, 2002-2007 warm and 2008-2013 overall cold.
1.1 1998-2013 was + or - long term trend within section 3.4 of the tropical pacific.
2. 1991-1997 was recovering from the eruption of Pinatubo and 1984 is also another such volcano. This gives the appearance of upwards of twice the warming.
2.1 I used the 1979-1984 before the volcano's in order to give a more accurate trend. Notice how per-eruption is warmer in both cases...This means forcing - volcanic forcing = new forcing. Volcano's negative forcing hasn't caused a long term effect on the trend after 10 years in both cases.
Short term 1-10 year forcings that we recover out of was smoothed over...
My second graph on the right shows the effects of the volcano's rebound.
Attachments
Last edited: