Climate Change Deniers are Almost Extinct

It's become increasingly difficult to find ANY evidence that you were sufficiently educated in Middle School. We've already established your inability to read graphs and understand the basics of logarithms and NOW --- your abysmal reading comprehension skills and logic are on full display..
Going by the evidence provided by your posts, it is very obvious that you are so retarded that brain damaged dogs could cheat you at cards. Every bit of denier cult drivel that you've posted has been completely debunked. You have no idea what is going on but you're so brainwashed by the fossil fuel industry propaganda that you mistakenly imagine that you know something about this area of science. In fact though, you're a faith-based, anti-science rightwingnut moron who just parrots the lies and idiotic pseudo-science you get off your denier cult blogs.
 
Last edited:
Oh yeah, gonna get cooler. No reason to worry about the ice just going down and down in the Arctic. 2.570 square kilometers on the Cryosphere chart;

Northern Hemisphere Sea Ice Area

That's YOUR JOB OldieRocks. And you do it quite well..


:lol:

Well, Flatulance, once again, I have been caught out. Remember, I predicted 2.7, possibly as low as 2.5. We are almost at 2.5 right now, and it is not even September yet. Wrong again.
 
It's become increasingly difficult to find ANY evidence that you were sufficiently educated in Middle School. We've already established your inability to read graphs and understand the basics of logarithms and NOW --- your abysmal reading comprehension skills and logic are on full display..
Going by the evidence provided by your posts, it is very obvious that you are so retarded that brain damaged dogs could cheat you at cards. Every bit of denier cult drivel that you've posted has been completely debunked. You have no idea what is going on but you're so brainwashed by the fossil fuel industry propaganda that you mistakenly imagine that you know something about this area of science. In fact though, you're a faith-based, anti-science rightwingnut moron who just parrots the lies and idiotic pseudo-science you get off your denier cult blogs.

So you didn't do well on the pop quiz eh princess? Don't worry. We'll save that little desk for you next year deary...
 
Oh yeah, gonna get cooler. No reason to worry about the ice just going down and down in the Arctic. 2.570 square kilometers on the Cryosphere chart;

Northern Hemisphere Sea Ice Area

That's YOUR JOB OldieRocks. And you do it quite well..


:lol:

Well, Flatulance, once again, I have been caught out. Remember, I predicted 2.7, possibly as low as 2.5. We are almost at 2.5 right now, and it is not even September yet. Wrong again.


:eusa_whistle:
 

Attachments

  • $3-subs-north-pole-1987.jpg
    $3-subs-north-pole-1987.jpg
    20.7 KB · Views: 41
The last time we had droughts like this in the midwest was in the 30's during the FDR Administration, therefore it can only be that Progressive Administrations cause droughts

I can make a chart, one line Progressiveness of the Administrations peaking with FDR and Obama, the other line will be severe droughts and they will match perfectly.

Science = Settled
 
According to a paper issued last week by the Met Office, there is a 92 per cent chance that both

The Met says that's bullshit, but we've been over that before.

1) What is the MINIMUM predicted temperature impact of weak SunSpot Cycle 25 on average temperatures?

I'm unaware of such projections, but it's not too hard to scratch one up. Normal trough-to-peak solar cycle temp variation is about +0.18C. If Cycle 25 was half of the normal, we'd take the average again and get about an -0.05C difference.

2) If Cycle 25 resembles the Maunder Minimum --- would that impact yield LOWER average Temps or HIGHER?

Lower, of course.

3) What is chance of this event NOT happening?

Probably 99%.

Which of these statements are correct? (Choose just one)

A) The Cycle 25 effect on temperature in the 21st Century is only 0.08degC.

Unknown, given that we have to wait until Solar Cycle 25 to find out.

B) The NET effect of Cycle 25 and "global warming" in the 21st Century would result in a cooling of between 0.08 and 0.13degC.

Totally wrong. Net affect is way, way positive.

C) The temperature difference between the Dalton Min and the Maunder Min is 0.05degC

Not sure. But it's commonly agreed that very high volcanic activity was the primary driver of the Dalton minimum low temperatures.

D) "...it's gonna warm a lot".... attributed to a DundrHead known as Rolling Thunder.

Definitely correct. Even if the solar output fell to Maunder Minimum levels, that would simply slow down the warming a bit. Forcings from greenhouse gases are vastly greater than any conceivable solar forcings.
 
You got less than half right Mamooth.. Expect to see me after class.

The article CORRECTLY states (directly from the MET) that the expected temp diff for a cycle similiar to the Dalton Min is about -2DegC. You missed that one?????

And I don't know where you got a 99% of "not happening" because the MET itself declared this to be 92% certain. Leaving a simple subtraction for you to botch..

THe MET declares that the NET EFFECT of this would result in a COOLING of at least 0.08degC.. (Don't blame me for the anal details -- take it up with the Authors). It would NOT continue to warm but this incredibly weak solar cycle would effectively "cancel" out the proposed warming that the IPCC projects using the most dire of scenarios.

(MET used the Worst case AGW anomaly and the Weakest solar forcing to arrive at their forecast AND they completely lost cred when they declared that the expected diff between Maunder and Dalton Mins to be all of 0.05degC)

Obviously, you're not taking this class seriously. And we BOTH know you could do better.

Since we can't agree on WHAT THE MET SAID -- in 2 simple paragraphs. And both TinkerBelle and yourself CAN'T READ --- this leaves us in an awkward place to continue a rational discussion doesn't it?

By the way Mamooth -- this MET brainfart confirms in detail the forecast made by Scaffetta several years ago - the scientist you called an astrologer a week or 2 ago.. I guess if it comes true -- you'd have to eat Fancy Feast for a week or two....
 
Last edited:
Seriously man.. Isn't there a Warmer who can read those 2 paragraphs and LITERALLY and FACTFULLY demonstrate understanding of them?

Not INTERPRET what the MET said. Not answer my questions with your own crapped out numbers. Not SMEAR the reporter that interviewed others for comment -- But the BASIC PREDICTION that the MET was making..

Does the OP understand how this makes it hard for Deniers and Skeptics to go extinct? Looks like we're still needed...
 
The article CORRECTLY states (directly from the MET) that the expected temp diff for a cycle similiar to the Dalton Min is about -2DegC. You missed that one?????

Why are you claiming that a fiction piece from David Rose is "directly from the MET"? You wouldn't happen to have a actual source from the Met, would you? No, I didn't think so. Don't worry, I do.

Since we can't agree on WHAT THE MET SAID -- in 2 simple paragraphs. And both TinkerBelle and yourself CAN'T READ --- this leaves us in an awkward place to continue a rational discussion doesn't it?

Of course we can agree on what the Met said, because the Met says it publicly and directly. There's no need to listen to arch-liar David Rose.

Met Office in the Media: 29 January 2012 « Met Office News Blog
---
It confirmed that although solar output is likely to reduce over the next 90 years this will not substantially delay expected increases in global temperatures caused by greenhouse gases. The study found that the expected decrease in solar activity would only most likely cause a reduction in global temperatures of 0.08 °C. This compares to an expected warming of about 2.5 °C over the same period due to greenhouse gases (according to the IPCC’s B2 scenario for greenhouse gas emissions that does not involve efforts to mitigate emissions). In addition the study also showed that if solar output reduced below that seen in the Maunder Minimum – a period between 1645 and 1715 when solar activity was at its lowest observed level – the global temperature reduction would be 0.13C.
---

I now await your no doubt very creative explanation as to why what the Met says isn't really what the Met says.
 
With the way the energy companies are bankrolling Romney don't be surprised if you don't start seeing a lot more of flacaltenn like nonsense showing up all over the place. The super rich seem to believe they can live through anything. Who knows, maybe they can.
Al Gore thinks he can, buying his beach house.
 
Ive seen some goofball threads in my day on this forum..........but this one takes goofball to a new level!!


How can the deniers be "extinct" when they are clearly winning!!!


If anything........the alarmists are extinct............Cap and Trade died three years ago, so obviously, your ordinary American couldnt give a rats ass about the "science". Google away s0ns.........THERES DAYS AND DAYS WORTH OF READING MATERIAL!!!..............like THIS >>>>>>>>>>>>>>


http://www.sustainablebusiness.com/index.cfm/go/news.display/id/21357

http://green.blogs.nytimes.com/2010/07/28/cap-and-trade-is-dead-long-live-cap-and-trade/

http://online.wsj.com/article/SB10001424052748703499404574558070997168360.html


http://science.time.com/2010/07/22/cap-and-trade-is-dead-really-truly-im-not-kidding-whos-to-blame/


http://www.politico.com/news/stories/0711/59620.html


peewee2-9.jpg
 
Last edited:
The environmental goofballs live life in a science bubble........as naive as the average cucumber.


Chapter 9: Conclusions

Canada’s Energy Future: Energy Supply and Demand Projections to 2035 provides a projection of Canadian energy supply and demand to the year 2035. The projections employ currently available information, trends, policies and technologies to form a view of the Canadian energy system over the next 25 years. Over the projection period, new information will become available, trends, policies and technology will evolve, and certain assumptions made in the report may no longer apply. Readers of this report should consider the projections a baseline for discussing Canada’s energy future, not a prediction of what will take place.
The results of the Reference Case imply three broad conclusions:
Energy supply grows to record levels

New and innovative ways of producing energy causes Canadian energy supply to reach its highest levels ever. Oil production doubles by 2035, with oil sands providing the majority of new production. Natural gas production reverses its historical declining trend by 2016 with tight and shale gas extraction driving production above record levels by the end of the projection period. Electricity production grows gradually as renewables, such as wind, hydro and biomass, make up a greater portion of the generating mix.:gay:

Projections for Canada energy out to 2035>>>>> NEB - Energy Reports - Canada?s Energy Future: Energy Supply and Demand Projections to*2035 - Energy Market Assessment


Ummm.........who's not losing??


:rock::2up::eusa_dance::fu::fu::fu::fu::fu:
 
Last edited:
Ummm.........who's not losing??

Just what do the rants and pictures the have to do with the fact that AGW denialists are considered to laughingstocks?

You could just 'fess up and admit that you were dutifully babbling whatever nonsense your cult ordered you to babble. After all, it's not like you were ever fooling anyone. But no, you're not emotionally capable of admitting those dirty environmentalists were right yet another time.

My suggestion? Just slink away in disgrace, along with the rest of the denialists. Memories are short, and in a few years, you'll be able to pretend you never believed something as dumb as denialism.
 
There are dozens of "educational" programs on TV today that give credible evidence for "Bigfoot" and "para-normal sightings". The same phony pseudo-science and fudged data and biased crazy hype is used by the international left to promote the phony crisis of "global-warming" as an extortion scheme to bring America to it's knees in a time of economic unrest.
 
Ummm.........who's not losing??

Just what do the rants and pictures the have to do with the fact that AGW denialists are considered to laughingstocks?

You could just 'fess up and admit that you were dutifully babbling whatever nonsense your cult ordered you to babble. After all, it's not like you were ever fooling anyone. But no, you're not emotionally capable of admitting those dirty environmentalists were right yet another time.

My suggestion? Just slink away in disgrace, along with the rest of the denialists. Memories are short, and in a few years, you'll be able to pretend you never believed something as dumb as denialism.



Sceptics are feared and hated by those (like you) who have a political agenda. Every time you clowns make a prediction it is proven wrong. Mann's methodology was proven false and it was shown that no matter what numbers you punched into his little algorithm warming was the result.

Sceptics are so feared that the climate mafia was forced to resort to unethical behavior and prevent studies being published that presented evidence that ran counter to what the climate mafia was stating.

And you claim we're the laughing stocks?:lol::lol::lol:

Your delusion is laughable on its face, you once again attempt to marginalise those who are threatening your illegal livelyhood. Nice try but the only laughing stocks are you and yours.
 
image_thumb12.png%3Fw%3D524%26h%3D384


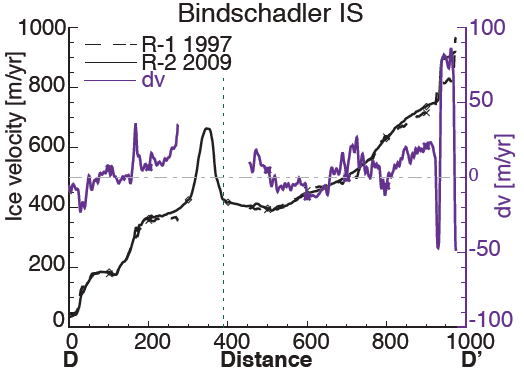
The above chart shows the correlation between the Obama and FDR Administrations and Midwest droughts. Pretend for a moment, using Michael's Mann substitution of Data method that instead of 0-1000, the numbers at the bottom range from 1920-2010, the assume that the range on the left is the relative Progressiveness of the Presidential Administration, finally the purple lines are US Presidents and the black line is Midwest droughts.

As you can see there is as perfect correlation between severe drought and the Administrations of FDR and Obama.

Progressives create droughts. Clearly, the science is settled.

I have peer-reviewed this post, and can find no fault with its conclusions.
 

Forum List

Back
Top