It wasn't warming during the solar minimum. It hasn't been warming since 1998. Yes we have had some of the warmest years due to declining from a peak but declining we are. As for the slowness of cooling see post #68.
8 of the 10 hottest years occurred between 1997 and 2008. How is that possible if we're cooling?
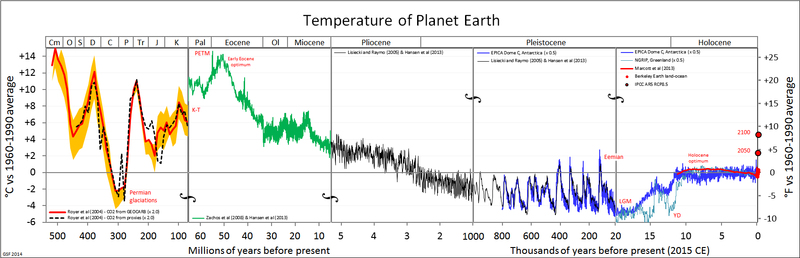
how is a sample of roughly 100 years significant when discussing a 6 billion year old entity?
Because this is when the industrial revolution occurred and it is impacting us now, and possibly in the future.
Ice core samples tell us a lot about the climate, much longer than 100 years, but it isn't conclusive, just another factor in the many to look at.
here's a thought; maybe dinosaur flatulence killed them off and it wasn't a comet