BEST algorithm on display

Skook and SSDD, please get a room. Nobody wants to see you two stroking each other in public. And I've told you before that it never turns out well for my obsessed crybaby stalkers, being they often end up self-destructing in such an amusing fashion.

Now, do you have something to say on the topic?

Like for example why, instead of looking at the science, you instantly assumed a conspiracy theory?

Does it bug you how nobody outside of the WUWT cult is paying any attention to Eschenbach's faceplant?

Are you pleased with the "Climate scientists are Nazis!" direction that WUWT is taking?

What does Occam's tell you about the likelihood of "The whole world is engaging in a vast secret global socialist conspiracy" compared to the likelihood of "You screwed up"?
 
Skook and SSDD, please get a room. Nobody wants to see you two stroking each other in public. And I've told you before that it never turns out well for my obsessed crybaby stalkers, being they often end up self-destructing in such an amusing fashion.

Au contraire hairball....it is you who is the crybaby....you proved that when you ran to the vet board looking from comfort from actual vets for being called a poser...didn't work out well for you there....did it.

Like for example why, instead of looking at the science, you instantly assumed a conspiracy theory?

Looked at the science and it isn't present in climate science....so if it isn't science but is being called science and is raking in hundreds of billions of dollars, what would you call it?

Are you pleased with the "Climate scientists are Nazis!" direction that WUWT is taking?

If the jack boot fits.....wear it. Again, look at the crick quote in my sig line for the attitude of your side.

What does Occam's tell you about the likelihood of "The whole world is engaging in a vast secret global socialist conspiracy" compared to the likelihood of "You screwed up"?

Occam tells me that if the model output doesn't match reality that they don't work...and if the models don't work it is because the hypothesis is wrong...and if the hypothesis is wrong, but it continues to be pushed as true...look at the money and when one follows the hundreds of billions being funneled into climate science which is pushing a failed hypothesis...what else is one to think?
 
I started this thread so that people could understand some of the problems with homogenization.

the instrumentation remains the same, the locality remains the same, yet BEST seems to think that the data should be adjusted, and kridge breaks put in. the data show cooling but 'adjusted' data is not so obvious.

I checked out a few other stations just by changing the station number in the URL. the same type of thing is happening elsewhere, both on land and in the ocean. homogenization without specific reasons just obscures the trends and seemingly adds a generalized warming.

Just the latest form of HIDE THE DECLINE...
 
remember all the fuss last summer about Goddard pointing out that ~30% of station data was not actual data but infill from computer programs? (that statement was true)

then Homewood checked the first station on the list and found it was indeed full of estimations and added warming?

I went to BEST to see how they covered Luling, and what their algorithm did to the data--

26477-TAVG-Raw.png


26477-TAVG-Alignment.png

wow! seven station moves and 10 empirical breaks.

Mean Rate of Change ( °C / Century )
Raw monthly anomalies -0.48
After quality control -0.51
After breakpoint alignment 0.62
Regional expectation during same months 0.70 ± 0.14
National average during same months 0.89 ± 0.10
Global land average during same months 1.05 ± 0.04

hmmmmmm......half a degree (C) of cooling turns into more than half a degree of warming. interesting.

I read the metadata page for Luling last summer and I dont remember seven station moves. I do remember the 2010 'move' was just an actual updating of the GPS coordinates.


every time someone looks closely at anything to do with climate science it stinks to high heaven. what is worse is that there are no explanations forthcoming, except for the generalized platitudes such as " our method is working as intended".
 
Following Goddard's conspiracies now? You're about the only one. Enjoy howling alone in the wilderness.

Billy, before you jump in, remember that current WUWT policy is anti-Goddard. It's like Stalinists battling Trotskyites, this WUWT/Goddard feud.
 
remember all the fuss last summer about Goddard pointing out that ~30% of station data was not actual data but infill from computer programs? (that statement was true)

then Homewood checked the first station on the list and found it was indeed full of estimations and added warming?

I went to BEST to see how they covered Luling, and what their algorithm did to the data--

26477-TAVG-Raw.png


26477-TAVG-Alignment.png

wow! seven station moves and 10 empirical breaks.

Mean Rate of Change ( °C / Century )
Raw monthly anomalies -0.48
After quality control -0.51
After breakpoint alignment 0.62
Regional expectation during same months 0.70 ± 0.14
National average during same months 0.89 ± 0.10
Global land average during same months 1.05 ± 0.04

hmmmmmm......half a degree (C) of cooling turns into more than half a degree of warming. interesting.

I read the metadata page for Luling last summer and I dont remember seven station moves. I do remember the 2010 'move' was just an actual updating of the GPS coordinates.


every time someone looks closely at anything to do with climate science it stinks to high heaven. what is worse is that there are no explanations forthcoming, except for the generalized platitudes such as " our method is working as intended".

You should look into some of the GCM's where they take three cities, poorly sited stations and input that average temp to cover all of the arctic. that's over 3,000 square miles, covering tundra which is historically 10 to 15 F degrees colder than the city locations which are near the oceans. It doesn't matter to them that their temps are inflated by as much as 6-15 deg F. It is also why many of the model outputs today show both the arctic and antarctic to be much warmer than they actually are. It has also affected global temp anomaly upward by 1.2 deg C. This is the area they do it in so that it is not readily apparent, unless your looking for it. Its how they are today calming that this year is the hottest ever when we have been cooling now for over 12 years with a global temp drop of -0.821 deg C. (USCRN and The Russian Climate Network ) I was amazed to find the RCN showing the drop as well, but then again Putin is not a rabid alarmist.

In just that last 12 years all of the Northern Hemisphere temp rise which occurred in the last 150 years is negated. The worse part about it is THEY KNOW IT and they still hide the data by using inflating models to tamper with it.
 
Last edited:
Following Goddard's conspiracies now? You're about the only one. Enjoy howling alone in the wilderness.

Billy, before you jump in, remember that current WUWT policy is anti-Goddard. It's like Stalinists battling Trotskyites, this WUWT/Goddard feud.

The hair ball wouldn't know science even if it bit it on the ass.. nor does it have a clue about Watts policies.. But as for your Alinsky tactics, you got them down pat.. Do you ever do anything but troll and name call?
 
[QUOTE="Billy_Bob, post: 10299225, member: 50952"You should look into some of the GCM's where they take three cities, poorly sited stations and input that average temp to cover all of the arctic. that's over 3,000 square miles[/QUOTE]

The Arctic is 5.5 million square miles
 
[QUOTE="Billy_Bob, post: 10299225, member: 50952"You should look into some of the GCM's where they take three cities, poorly sited stations and input that average temp to cover all of the arctic. that's over 3,000 square miles

The Arctic is 5.5 million square miles[/QUOTE]

LOL.. then Crick doesn't take into account the RCN 2.5k square miles side of the area.. And what data do they use for that area? The two GCM's we are currently evaluating require us to use the RCN data for their area. It makes quite a difference who's data you use..
 
http://www.usatoday.com/story/news/...nks--climate-change-thaws-permafrost/2794255/

USA TODAY traveled to the Fairbanks area, where workers were busy insulating thaw-damaged roads this summer amid a record number of 80-degree (or hotter) days, as the eighth stop in a year-long series to explore how climate change is changing lives.

The pace of permafrost thawing is "accelerating," says Vladimir Romanovsky, who runs the University of Alaska's Permafrost Laboratory in Fairbanks. He expects widespread degradation will start in a decade or two. By mid-century, his models suggest, permafrost could thaw in at least a third of Alaska and by 2100, in two-thirds of the state.

"This rapid thawing is unprecedented" and is largely due to fossil-fuel emissions, says Kevin Schaefer of the National Snow and Ice Data Center in Boulder, Colo. He says it's already emitting its own heat-trapping carbon dioxide and methane, but the amount will skyrocket in the next 20 to 30 years. "Once the emissions start, they can't be turned off."

Might want to discuss the idea that the Arctic is not warming with some Alaskans before you make an ass of yourself on yet another subject.
 
Alaska sinks as climate change thaws permafrost

USA TODAY traveled to the Fairbanks area, where workers were busy insulating thaw-damaged roads this summer amid a record number of 80-degree (or hotter) days, as the eighth stop in a year-long series to explore how climate change is changing lives.

The pace of permafrost thawing is "accelerating," says Vladimir Romanovsky, who runs the University of Alaska's Permafrost Laboratory in Fairbanks. He expects widespread degradation will start in a decade or two. By mid-century, his models suggest, permafrost could thaw in at least a third of Alaska and by 2100, in two-thirds of the state.

"This rapid thawing is unprecedented" and is largely due to fossil-fuel emissions, says Kevin Schaefer of the National Snow and Ice Data Center in Boulder, Colo. He says it's already emitting its own heat-trapping carbon dioxide and methane, but the amount will skyrocket in the next 20 to 30 years. "Once the emissions start, they can't be turned off."

Might want to discuss the idea that the Arctic is not warming with some Alaskans before you make an ass of yourself on yet another subject.

More left wit propaganda with no scientific basis.. And wouldn't you know Old Crock is the one spouting it...

Show us where this has NEVER HAPPENED BEFORE and how it is somehow unprecedented... Too Funny.... An article written in Aug is held for publishing until mid December... Agenda or propaganda or both?
 
Last edited:
Clearly the unaltered data's refusal to show any warming can only mean that it's a DENIER!!!! and must be adjusted accordingly
 
time for another comparison.

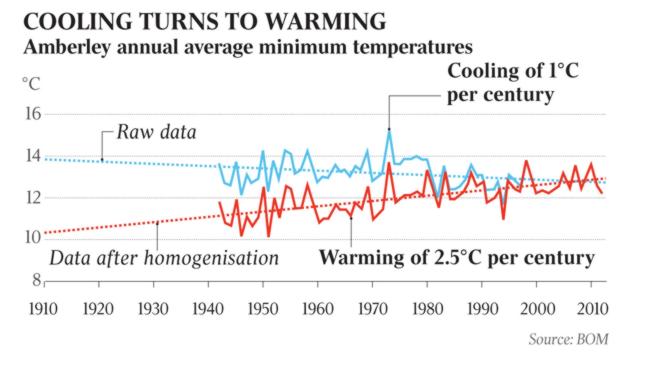
Amberley Australia temp records have been criticized this year.

875141-a5eda3f6-2a03-11e4-80fd-d0db9517e1161.jpg

quote from BOM explanation of adjustments-
"
Observations at Amberley began in 1941. Comparison of the Amberley data with surrounding stations
(neighbours), 18 of which have been used at various times, combined with the use of documentary records,
reveals that there have been two significant breaks in the data. The first of these is associated with a change
to the time of recording observations. The source of the second is unclear but the size of the change is
consistent with a site move. The raw data series is a combination of several data series that must be adjusted
to derive a single, consistent and accurate representation of temperature changes over time.
The ACORN-SAT record contains daily records of minimum (night-time) temperature (Min T) and maximum
(daytime) temperature (Max T). The charts in this fact sheet show annual average values of Min T and Max T.
The impacts of the daily adjustments on the annual average values are shown in the table below.
The changes that occurred at Amberley and the resulting impacts are summarised as follows:
1. 1 January 1964—standard observation time at this site changed from midnight to 9 am.
• Mean temperatures remain similar with respect to surrounding stations, but some indication of
changes in extremes.
• Min T adjusted by -0.02 °C on an annual basis but larger adjustments to some extremes. No
detectable impact on Max T so no adjustments made.
2. 1 January 1980—breakpoint detected by statistical methods.
• Night-time temperatures started to appear much cooler relative to surrounding stations.
• No accessible documentation for Amberley in 1980, but a breakpoint of this size would normally
be associated with a site move.
• Min T adjusted by -1.28 °C; no detectable impact on Max T so no adjustments made.
"

interesting.....only the min temps were in need of 'repair'. in BOM's next example only the max temps were in need of fixing. Australian Climate Observations Reference Network - Surface Air Temperature (scroll down for pdfs)

GISS v.2 from 2011

station_thumb.gif


GISS v.3 from 2014

station_thumb1.gif


BEST graph

152217-TAVG-Alignment.png

Mean Rate of Change ( °C / Century )
Raw monthly anomalies 0.01
After quality control 0.04
After breakpoint alignment 1.39

odd that BEST doesnt mention TOBS. I guess it doesnt matter unless you want to 'fix' something that isnt running according to expectations.

This would be an excellent add to my thread on this precise subject. --> Alarmist Adjustments of GISS NOAA Data are fraud on the US Citizens.. US Message Board - Political Discussion Forum


sure, quote it anywhere you want to. I thought that thread had been sidetracked by Old Rocks discussing extinction events.
 
time for another comparison.

Amberley Australia temp records have been criticized this year.

875141-a5eda3f6-2a03-11e4-80fd-d0db9517e1161.jpg

quote from BOM explanation of adjustments-
"
Observations at Amberley began in 1941. Comparison of the Amberley data with surrounding stations
(neighbours), 18 of which have been used at various times, combined with the use of documentary records,
reveals that there have been two significant breaks in the data. The first of these is associated with a change
to the time of recording observations. The source of the second is unclear but the size of the change is
consistent with a site move. The raw data series is a combination of several data series that must be adjusted
to derive a single, consistent and accurate representation of temperature changes over time.
The ACORN-SAT record contains daily records of minimum (night-time) temperature (Min T) and maximum
(daytime) temperature (Max T). The charts in this fact sheet show annual average values of Min T and Max T.
The impacts of the daily adjustments on the annual average values are shown in the table below.
The changes that occurred at Amberley and the resulting impacts are summarised as follows:
1. 1 January 1964—standard observation time at this site changed from midnight to 9 am.
• Mean temperatures remain similar with respect to surrounding stations, but some indication of
changes in extremes.
• Min T adjusted by -0.02 °C on an annual basis but larger adjustments to some extremes. No
detectable impact on Max T so no adjustments made.
2. 1 January 1980—breakpoint detected by statistical methods.
• Night-time temperatures started to appear much cooler relative to surrounding stations.
• No accessible documentation for Amberley in 1980, but a breakpoint of this size would normally
be associated with a site move.
• Min T adjusted by -1.28 °C; no detectable impact on Max T so no adjustments made.
"

interesting.....only the min temps were in need of 'repair'. in BOM's next example only the max temps were in need of fixing. Australian Climate Observations Reference Network - Surface Air Temperature (scroll down for pdfs)

GISS v.2 from 2011

station_thumb.gif


GISS v.3 from 2014

station_thumb1.gif


BEST graph

152217-TAVG-Alignment.png

Mean Rate of Change ( °C / Century )
Raw monthly anomalies 0.01
After quality control 0.04
After breakpoint alignment 1.39

odd that BEST doesnt mention TOBS. I guess it doesnt matter unless you want to 'fix' something that isnt running according to expectations.


no comments from the warmers peanut gallery, eh?

ok, I'll just give answers to unasked questions. first up- was the 1980 break point real? I dont know. there was no documented changes to location or instrumentation to explain it. it was 'found' by comparing this station to other stations in a several hundred kilometre radius, regardless of type of environment. next- what was the error and how was it corrected? pre 1980 temps seemed to follow the same trend as other locations, post 1980 temps seemed to be cooler. so, of course, in accordance to climate science logic, they cooled the pre 1980 readings instead of warming the questioned post 1980 ones.


it would be interesting to see if Australia puts as much 'estimated' readings into their dataset as the USA does. and whether they run zombie stations that keep reporting long after they have been closed.


it would be nice if the TOBS adjustments were explained a bit more clearly. -0.02C seems small to me. none of the other five expanded explanations carries a TOBS change.
 
Eschenbach has been caught mangling data so many times, he's not even taken seriously at WUWT. He's just the guy Watts goes to when he needs a quick diversion. In this case, it's to divert from the big disgrace where Watts gleefully published Tim Ball screaming how all climate scientists were Nazis. Yes, a fine example of WUWT "science".

I don't think Eschenbach is deliberately fudging here. He's just profoundly clueless, always instantly assigning a vast socialist conspiracy to explain things he doesn't understand, which would be essentially everything. He's a kindred soul to Billy here.
and more looney from the left!!!! thanks for the laugh of the day so far!!! :badgrin::badgrin:
 
Skook and SSDD, please get a room. Nobody wants to see you two stroking each other in public. And I've told you before that it never turns out well for my obsessed crybaby stalkers, being they often end up self-destructing in such an amusing fashion.

Now, do you have something to say on the topic?

Like for example why, instead of looking at the science, you instantly assumed a conspiracy theory?

Does it bug you how nobody outside of the WUWT cult is paying any attention to Eschenbach's faceplant?

Are you pleased with the "Climate scientists are Nazis!" direction that WUWT is taking?

What does Occam's tell you about the likelihood of "The whole world is engaging in a vast secret global socialist conspiracy" compared to the likelihood of "You screwed up"?
so this is an example of participating in the thread? Look at the old fart calling the kettle black! dude/ dudette, try using your own advice!! You're posts are boring!!!!
 

Forum List

Back
Top