USHCN Data

IanC

Gold Member
Sep 22, 2009
11,061
1,344
245
image_thumb21.png


As can be seen, there has been a steady climb in the percentage since the 1990’s. For 2013, the total number of estimated months was 5125, representing 35.1% of the annual total.

This is the highest percentage since 1905. The number of estimates is alarmingly high, and appears to be growing.

There are 254 stations, or 21% of the total of 1218, where there are no readings at all for 2013.
Analysis Of USHCN Dataset | NOT A LOT OF PEOPLE KNOW THAT


estimated does not mean adjusted. the vast majority of raw data are adjusted for one reason or another. estimated data is infilled by algorithm because there was no data deemed acceptible.

Estimating/Infilling


This all brings us round to the question of how temperatures are estimated.

The USHCN V2 website explains how their homogenisation software compares station trends with a number (up to 40) of highly correlated series from nearby stations. This is used not only to adjust for non-climatic biases, such as station moves, but also to estimate temperatures where infilling is necessary, and even to adjust for UHI.

The key point here is that the “nearby stations” will not necessarily be USHCN stations, which are regarded as “high quality”. Indeed, it is extremely likely that the vast majority of such stations will be non-USHCN.

Much of the detail behind the latest “Gridded” system in use for US Climate Divisions, just introduced in February, is contained within an AMS paywalled paper, “Improved Historical Temperature and Precipitation Time Series for U.S. Climate Divisions”. This shows how thousands of stations have been added to the database, many with very short and/or extremely incomplete records.

These in turn have to be “homogenised” to fill in their gaps. So we find that USHCN stations are homogenised against stations that have themselves been estimated.


The danger is clear – the USHCN sites, which have been selected as high quality, and with long, well documented records, are at risk of being swamped by potentially unsuitable sites. Far from the latter being adjusted to the trend of USHCN stations, the opposite is likely to occur.


bad sites, which have been shown to be warmer on average, influence good sites. every bit of extra warming then influences the homogenization process whereby warming readings are expected and cooling readings are rejected and filled in with (you guessed it) warming readings from other lower quality stations. one would expect to see a slow creep of rising temperatures over the history of the data set with this method, and you do. the reported numbers for 1995-2005 get a little higher every year. the 2007 version is warmer, the 2009 version is warmer still, etc.
 
Last edited:
Yeah, we keep all the military's top secret projects and plans behind paywalls because no one can get past a paywall. You can't get any more secure than that.

Why don't you file an FOIA request?
 
I'd like to point out that this bit of amateur 'analysis' includes not the slightest attempt to ascertain the affect the noted adjustments had on these data's ACCURACY. We are still looking at the assumption that any adjustment must have been made to make a false case for global warming. He spends not one second examining the justifications and explanations that NOAA HAS provided.
 
Yeah, we keep all the military's top secret projects and plans behind paywalls because no one can get past a paywall. You can't get any more secure than that.

Why don't you file an FOIA request?

??????????
 
sorry, I didnt notice the graph was not showing. fixed
 
I'd like to point out that this bit of amateur 'analysis' includes not the slightest attempt to ascertain the affect the noted adjustments had on these data's ACCURACY. We are still looking at the assumption that any adjustment must have been made to make a false case for global warming. He spends not one second examining the justifications and explanations that NOAA HAS provided.


the main point of this exercise is to show people how much of the data is fabricated out of the algorithms. how many people would know that >10% of all values presented by USHCN were infilled estimates? how many people know that in 2013, last year!, that more than 20% of the stations that make up the official record had no readings at all!!!

if you wish to believe that poorly sited station data can be mathematically manipulated to produce more accurate data, which is then attributed to a well sited station, then I suppose you dont understand error ranges.

a teaspoon of shit sitting on a gallon of ice cream can be somewhat fixed. but not after you mix it all together. then you just have a gallon of shit
 
Last edited:
I'd like to point out that this bit of amateur 'analysis' includes not the slightest attempt to ascertain the affect the noted adjustments had on these data's ACCURACY. We are still looking at the assumption that any adjustment must have been made to make a false case for global warming. He spends not one second examining the justifications and explanations that NOAA HAS provided.
How are you going to determine its accuracy, when so much data was distorted or discarded?

What are you going to compare it to? Wishful thinking?
 
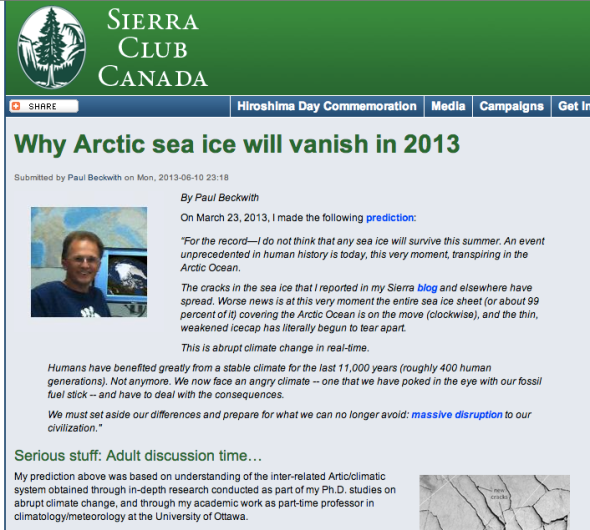
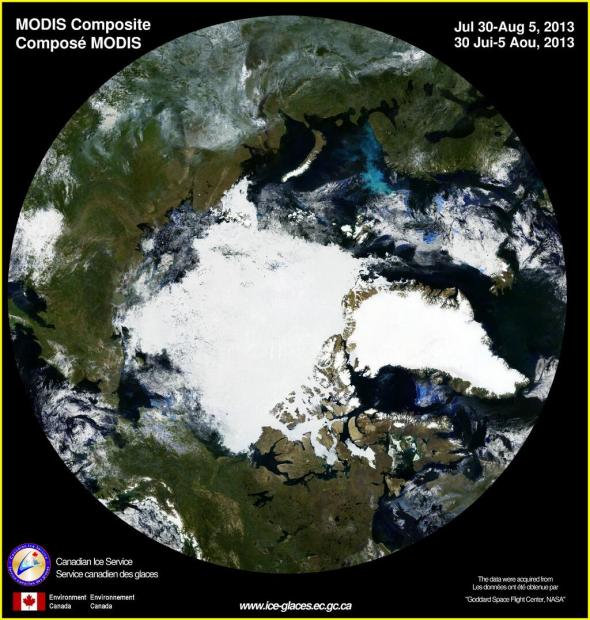
What to compare the data of warming to? How about glacial recession, world wide? I have seen that up close and personal in the Cascades, Sierras, and Rockies. How about the melting of the continental ice caps? Greenland and Antarctica? The thawing of the permafrost in Siberia, and the North American Arctic? What about the fact that almost certainly the whole of the Arctic Ocean will be open water by 2030, far sooner than 2100 date that the 'alarmists' were talking about less than two decades ago.
 
What to compare the data of warming to? How about glacial recession, world wide? I have seen that up close and personal in the Cascades, Sierras, and Rockies. How about the melting of the continental ice caps? Greenland and Antarctica? The thawing of the permafrost in Siberia, and the North American Arctic? What about the fact that almost certainly the whole of the Arctic Ocean will be open water by 2030, far sooner than 2100 date that the 'alarmists' were talking about less than two decades ago.

I said wishful thinking is disallowed.

You compare temperature data to other temperature data.

Dumbass.
 
What to compare the data of warming to? How about glacial recession, world wide? I have seen that up close and personal in the Cascades, Sierras, and Rockies. How about the melting of the continental ice caps? Greenland and Antarctica? The thawing of the permafrost in Siberia, and the North American Arctic? What about the fact that almost certainly the whole of the Arctic Ocean will be open water by 2030, far sooner than 2100 date that the 'alarmists' were talking about less than two decades ago.

what is the temperature that glaciers are stable? they have been dramatically retreating for over 150 years worldwide. what was the optimum temperature?
 
What to compare the data of warming to? How about glacial recession, world wide? I have seen that up close and personal in the Cascades, Sierras, and Rockies. How about the melting of the continental ice caps? Greenland and Antarctica? The thawing of the permafrost in Siberia, and the North American Arctic? What about the fact that almost certainly the whole of the Arctic Ocean will be open water by 2030, far sooner than 2100 date that the 'alarmists' were talking about less than two decades ago.

You and yours are alarmists...always have been...always will be. And when your alarmist claims fail to materialize...you pretend as if you never made them.

The HYPE

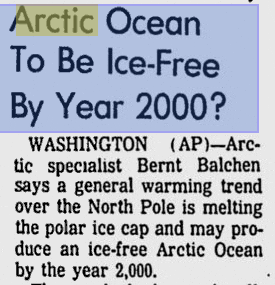
From 1972:

screenhunter_14-may-10-03-16.gif


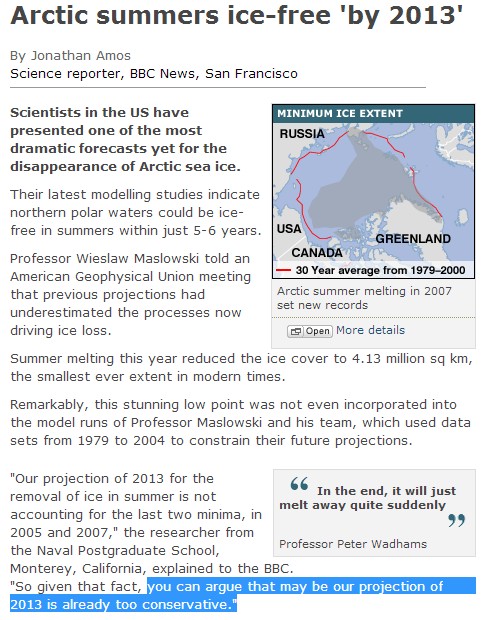
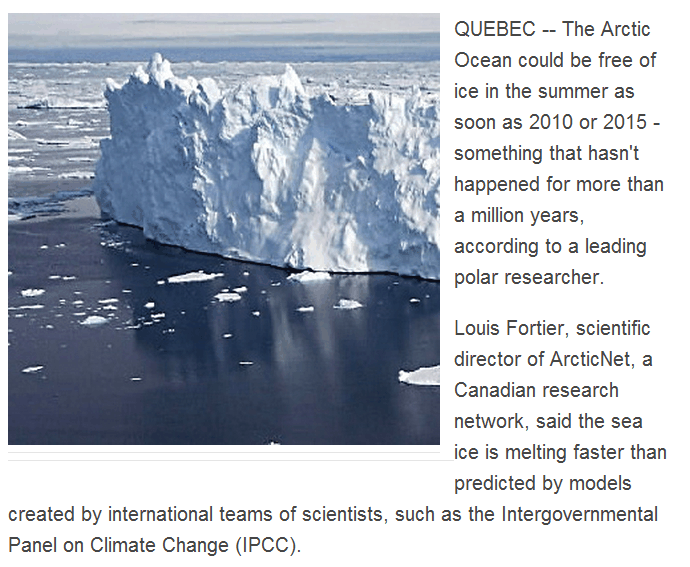
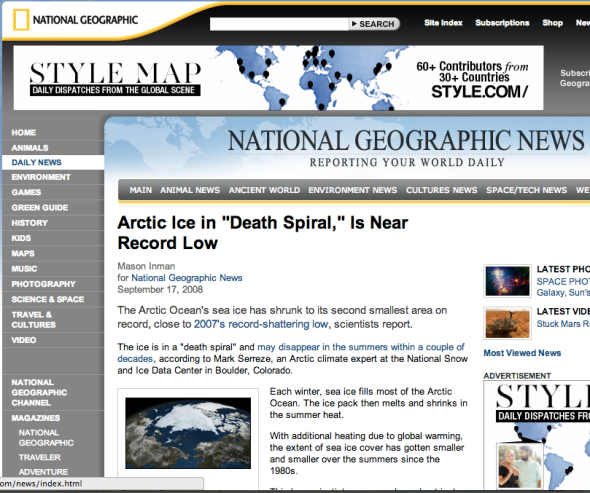
From more recently:

screenhunter_447-may-23-05-48.jpg


Arctic Ice is Melting | National News | United States | Epoch Times

screenhunter_93-apr-25-20-53.gif


screen-shot-2013-07-31-at-july-31-1-01-12-pm.png

BBC News - New warning on Arctic sea ice melt

screen-shot-2013-07-31-at-july-31-12-57-25-pm.png


THE FACTS

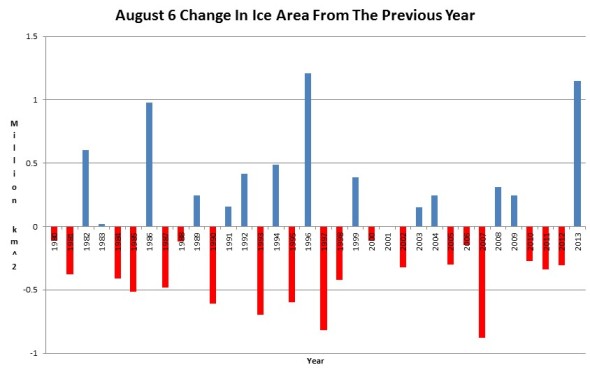
ice-free-arctic.jpg


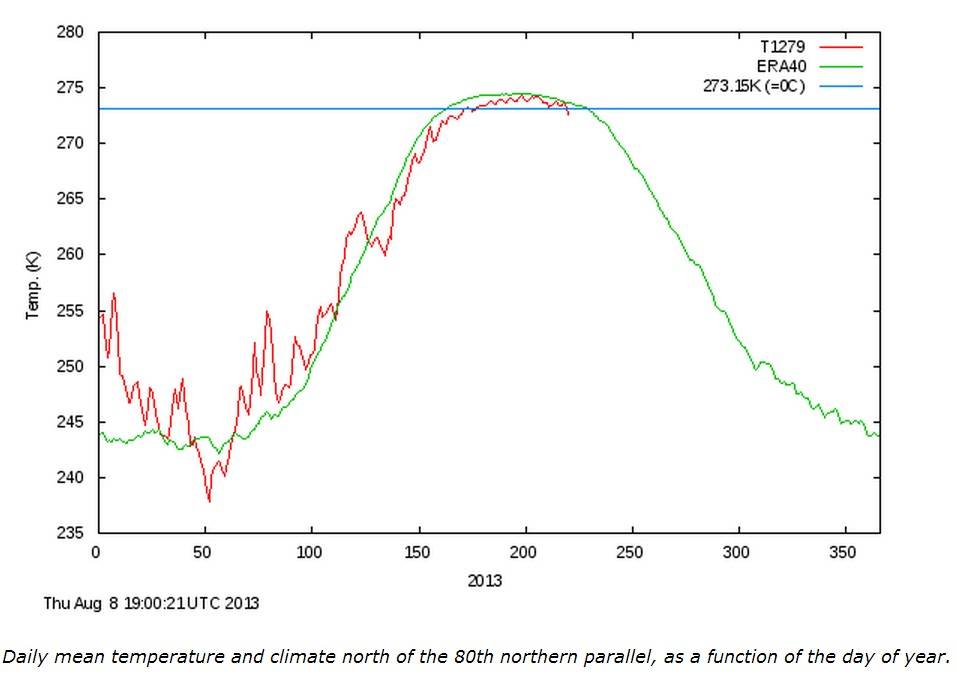
screenhunter_64-aug-07-22-23.jpg


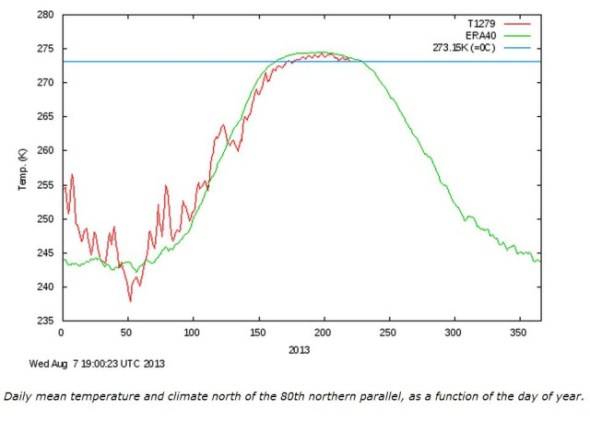
screenhunter_36-aug-07-16-43.jpg


screenhunter_01-aug-08-18-14.jpg


screenhunter_60-aug-10-00-17.jpg


arctic-2nd-lowest-melt.jpg


aaa1.jpg
 
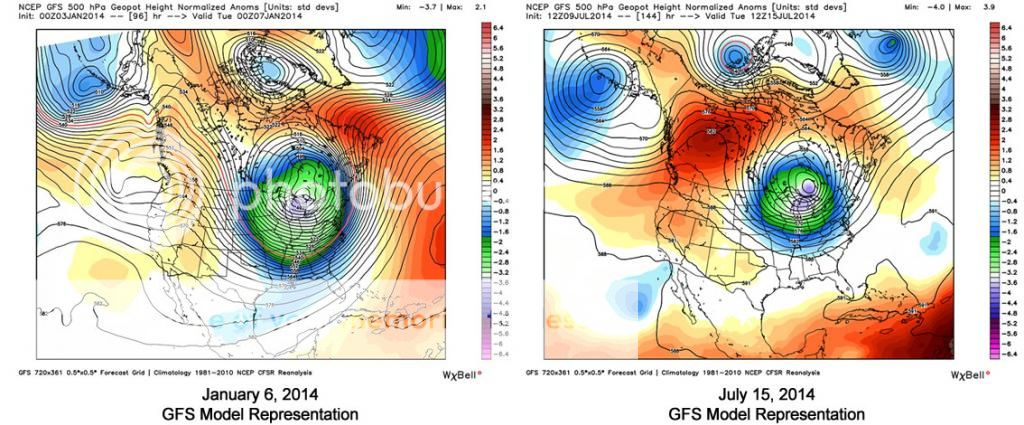
The Polar Vortex Is Back... In The Middle Of July

But just to make sure that the abysmal Q1 GDP which has now spilled over into Q2 and will likely see the US economy growing in the mid-2% range, has a sufficiently broad "excuse" in the third quarter of the year, here comes - in the middle of July - the polar vortex 2.0. As WaPo reports Poor man?s polar vortex to make shocking summer return in eastern U.S. next week, "However you choose to refer to the looming weather pattern, unseasonably chilly air is headed for parts of the northern and northeastern U.S at the height of summer early next week."

twins-gfs.jpg


Bearing a haunting resemblance to January’s brutally cold weather pattern, a deep pool of cool air from the Gulf of Alaska will plunge into the Great Lakes early next week and then ooze towards the East Coast.

Check out the rest here.

The Polar Vortex Is Back... In The Middle Of July | Zero Hedge


Some really cool, no pun intended, maps showing some cold ass chit coming..... Global warming my a$$.

The global warming :gay: club whackos will head to Death Valley to mark a 110 degree day. .. :lol:

-Geaux
 
I am always bewildered by the lack of interest in temperature dataset adjustments. does everyone just believe that the adjustments are correct and carried out in an evenhanded fashion? does no one care that anytime you actually inspect a specific example that the adjustments seem at odds with what is supposed to be done according to the explanations of the algorithms?
 
I am always bewildered by the lack of interest in temperature dataset adjustments. does everyone just believe that the adjustments are correct and carried out in an evenhanded fashion? does no one care that anytime you actually inspect a specific example that the adjustments seem at odds with what is supposed to be done according to the explanations of the algorithms?

The only wonder is why real scientists don't boot these AGW Frauds off campus and out of the labs. Oh right, they wouldn't be caught dead in a lab.


lol, real scientists stay away from climate science because they know that anything they say will be bad for their career.
 
I am always bewildered by the lack of interest in temperature dataset adjustments. does everyone just believe that the adjustments are correct and carried out in an evenhanded fashion? does no one care that anytime you actually inspect a specific example that the adjustments seem at odds with what is supposed to be done according to the explanations of the algorithms?

I care. I've been saying the data is tainted since I came here on this board.
 
What to compare the data of warming to? How about glacial recession, world wide? I have seen that up close and personal in the Cascades, Sierras, and Rockies. How about the melting of the continental ice caps? Greenland and Antarctica? The thawing of the permafrost in Siberia, and the North American Arctic? What about the fact that almost certainly the whole of the Arctic Ocean will be open water by 2030, far sooner than 2100 date that the 'alarmists' were talking about less than two decades ago.

Why don't you compare it to the incidence of psoriasis in the United States? That would make just as much sense.
 
Deniers, while you're thinking up creative new conspiracy theories, the science has simply moved on without you. You're not even visible in the rear view mirror. If anyone brings you up, it's just to say "remember those kooks we used to laugh at? Whatever happened to them?".

If you'd like to be something other then irrelevant, you need to do some science. Sitting here preaching to the choir isn't going to accomplish anything, other than earning you brownie points with your cult. If that's your goal, keep at it, but understand how you've become irrelevant to those outside the cult.

And yet here you are. It must bother you that your science ideals are being dismantled. Perhaps if someone had gone to the lab and actually proven the hypothesis, we wouldn't be here, but alas it is where we are and science is getting pounded.

Thanks for playing! Winning!
 

Forum List

Back
Top