Well, those were off the top of my head from calculations I did earlier today: NSA apr 2008-apr 2012, net change in NILF and the age groups. I used the one scree database at Current Population Survey (CPS)About 30% of that increase is over 65s. About 20% are 16-24s and a good chunk is married women. Hard to break things down exactly.
You're peak categories of over 65 and 16-24 is consistent with my peaks at 20 to 24 and 65 to 69.
The BLS ftp site has the entire data set available in one big flat file. Category descriptors are indexed separately.
How did you calculate your numbers? 30% from when to when? A 30% increase in the NILF?
Navigation
Install the app
How to install the app on iOS
Follow along with the video below to see how to install our site as a web app on your home screen.
Note: This feature may not be available in some browsers.
More options
You are using an out of date browser. It may not display this or other websites correctly.
You should upgrade or use an alternative browser.
You should upgrade or use an alternative browser.
April Jobs report looks dismal, March numbers to be revised????
- Thread starter JRK
- Start date
Nope, you can't divide by zero.the reason they're not classified as unemployed is because they either were not trying to work or could not have accepted a job if offered. In other words they weren't available for work that month. The UE rate is designed to measure how much absolve labor isn't being used...how many people could have found work and didn't. The special groups of marginally attached and it's subgroup of discouraged are tracked because these are people likely to start looking.
About 30% of that increase is over 65s. About 20% are 16-24s and a good chunk is married women. Hard to break things down exactly.
Great let's kill all jobs and we will have 0 unemployment
But that's how the government is getting the unemployment rate they are using. The more people who leave the work force the lower unemployment goes. I really don't care why you can and can't divide by zero
- Thread starter
- #383
Nope, you can't divide by zero.Great let's kill all jobs and we will have 0 unemployment
But that's how the government is getting the unemployment rate they are using. The more people who leave the work force the lower unemployment goes. I really don't care why you can and can't divide by zero
Thank you
The Employment to population ratio has actually the same in the last 12 months
I have been stating this for a while now and it has been ignored
The media has covered this phenom some, but this is THE story about job growth
We are not creating any jobs
take out Texas
La
Oklahoma
ND
SD
we are in real trouble and what is it they all have in common?
Yes we are in trouble the left seems to think we aren't.Nope, you can't divide by zero.
But that's how the government is getting the unemployment rate they are using. The more people who leave the work force the lower unemployment goes. I really don't care why you can and can't divide by zero
Thank you
The Employment to population ratio has actually the same in the last 12 months
I have been stating this for a while now and it has been ignored
The media has covered this phenom some, but this is THE story about job growth
We are not creating any jobs
take out Texas
La
Oklahoma
ND
SD
we are in real trouble and what is it they all have in common?
Trajan
conscientia mille testes
rtw states?
itfitzme
VIP Member
Well, those were off the top of my head from calculations I did earlier today: NSA apr 2008-apr 2012, net change in NILF and the age groups. I used the one scree database at Current Population Survey (CPS)About 30% of that increase is over 65s. About 20% are 16-24s and a good chunk is married women. Hard to break things down exactly.
You're peak categories of over 65 and 16-24 is consistent with my peaks at 20 to 24 and 65 to 69.
The BLS ftp site has the entire data set available in one big flat file. Category descriptors are indexed separately.
How did you calculate your numbers? 30% from when to when? A 30% increase in the NILF?
Excellent, same data set, same time period. You even went April to April to jump the seasonal variation. Explains why we get the same conclusion, in general. I'll accept your specific percentages.
I'm still working on how to normalize for population growth. I think it's gonna have to be a percentage change in the percentage of NILF to CPOP. But that is just to convoluted put in to prose. Really, a rate of change of a ratio? It would be so much easier if people would stop having extra babies.
Nope, you can't divide by zero.Great let's kill all jobs and we will have 0 unemployment
But that's how the government is getting the unemployment rate they are using. The more people who leave the work force the lower unemployment goes. I really don't care why you can and can't divide by zero
How exactly do you think the govt is doing it, rather than simply reporting the numbers the same as always?
Nope, you can't divide by zero.
But that's how the government is getting the unemployment rate they are using. The more people who leave the work force the lower unemployment goes. I really don't care why you can and can't divide by zero
How exactly do you think the govt is doing it, rather than simply reporting the numbers the same as always?
You can argue that the numbers that the obama labor department releases are true an accurate all you want, but the people you can't argue with are those millions who are unemployed and if things don't turn around soon your argument will be dead in the water run over by rioting people
- Thread starter
- #389
Yes we are in trouble the left seems to think we aren't.But that's how the government is getting the unemployment rate they are using. The more people who leave the work force the lower unemployment goes. I really don't care why you can and can't divide by zero
Thank you
The Employment to population ratio has actually the same in the last 12 months
I have been stating this for a while now and it has been ignored
The media has covered this phenom some, but this is THE story about job growth
We are not creating any jobs
take out Texas
La
Oklahoma
ND
SD
we are in real trouble and what is it they all have in common?
There still talking about the baby boom as it has something to do with, well I do not know that there point is
I guess there trying to spin this data to state that the reason the not-in data is a reflection of baby boomers?
Its all over the place
There is a simple way to resolve problems in life and especially in business
why is the UE rate dropping when we are adding so few jobs??
Because the civilian labor force is not growing and has actually shrunk 500k in the last 2 months
Civilian noninstitutional population
239,146 one year 242,784
Civilian labor force
153,420 one year 154,365
the rest has went into the not-in list
85,726 one year 88,419
Employment-population ratio
58.4 one year 58.4
we have created 0 jobs in the last year in reality as there has been well over twice as many people left the work force than has entered it
all this means is there is your lowering the UE rate by subtracting those who have left the work force, not really adding jobs
And what baby boomers has to with that is not to the level we are seeing, not even close
Even if it was 100%, there is still no jobs being created
Last edited:
itfitzme
VIP Member
JFK said:from Dec of 2011 to April of 2012 the not in number has grown all most 2 million people with 500k from march to April during the same time the civilian labor force has grown 400,000 Table A-1. Employment status of the civilian population by sex and age (Table A-1. Employment status of the civilian population by sex and age)
Those graphs will not reflect that explosion in which during the same time (from Nov 11) we have went from a 9% UE rate to a 8.1 All of your research will not reflect that. This has been my question from the start
How can the number of UE drop 500,000 in the same time period but the UE rate drop a full 1% *_Employment-population ratio_*
58.4 58.5 58.5 58.6 58.5 58.4
there is your answer
that rate has not dropped in a full year
only the not in rate has made the UE rate drop
You know, what really erks me is that you actually aren't interested in what the numbers spell out, just that you should prove some pre-determined position. That's the sense I'm getting.
You said, "My issue is and has been the not-in work force # is sky rocketing"
Now your question is otherwise, that it is "How can the number of UE drop?"
So suddenly, you don't like the answer so your changing the question.
My research is based on the entire BLS CPS data set which they are so kind as to provide on an ftp site. It can and does reflect exactly what is going on, including the "explosion" in which the UE rate went from 9% to 8.1%.
It would help if you would include the period of time and if you are referring to seasonally adjusted or unadjusted. It is impossible to speak to your numbers if you don't say what exactly they refer to.
I'm not contesting the fact that the April UE rate dropped on a decrease in the labor force.
The labor force falls all the time. It declined from July of 2011 to December of 2011, climbing again through March of 2012 then falling again in April.
I really couldn't careless about a particular month because a) I look an unadjusted numbers which are not seasonally adjusted and b) there is variance due to 1) seasonality and 2) randomness.
That's why I looked at the overall change from 2007 through 2012, to see what the trend has been. And the trend has been that, as pingy confirmed, 20-24 year old and 60-65 year old categories have been a major contributor to the over all increase in the NILF.
The over riding question is what the trend is, not what a particular month happened to be.
And the employment to population ratio has been fairly flat for two years. It's got this seasonal variation. It seems to have declined in 2010, ever so slightly, then increased, ever so slightly, in 2011. But the decline and increase are so slight as to be pretty meaningless.

That the employment to population ratio has been fairly flat tells us that the market has been adding jobs at least so fast as to keep up with population growth. Thank the markets for that much.
That the employment to population ratio has been flat is why we get into this whole question of exactly what is affecting the other numbers.
How can the UE ratio change, decrease or increase while employment remains flat? How can the NILF to CPOP increase while the employment to population ratio remains flat?
Is there some structural change going on? Is there a particular labor group that is being hit particularly hard?
And it seems that your getting all pissy about one statistic or another, now the UE rate, because you're looking for one statistic to prove something. Good for you, you've "proven" something. Woo hoo. Now you can run around screaming, "throw the bastards out?" Of course, you'll just end up with more bastards in the end with no clue what's really going on. Of course, you'll just end up with more bastards in the end with no clue what's really going on. You will just stick you're head in the sand, ignoring that you're bastards are as crappy as any others. But, if your are in denial, it all feels good.
But you said, "My issue is and has been the not-in work force # is sky rocketing" and two people have answered it the same 1) 20-24 year olds have increased it and 2) 65-69 year olds have increased it.
I find it particularly odd that the NILF/CPOP increased, the LF/CPOP decreased, and the EMP/CPOP has been flat.
But now you want to know "How can the number of UE drop?"
Well,
CPOP is UNEMP + EMP + NILF
LF is UNEMP + EMP
So, 1 = UNEMP/CPOP + EMP/CPOP + NILF/CPOP
1= LF/CPOP + NILF/CPOP
UE rate is Unemp/LF
E rate is Emp/LF
EU + E = 1
And my question is, how can EMP/CPOP remain constant whle EU falls?
The answer is in there somewhere.
And it might have something to do with this graph,
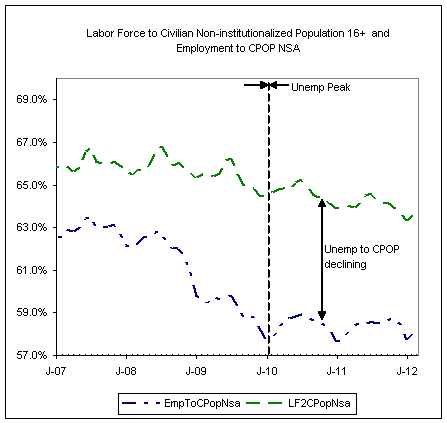
In order for employment to fall as a percentage of population while employment as a percentage is steady, the labor force as a percentage must decrease. It decreases because population is coming up underneath it.
That's all find, but it's not getting to EU as EU isn't over CPOP, it's over LF. And while LF/CPOP may necessarily decline, it doesn't mean that EU must.
But thankfully, EMP/CPOP is flat so it's not a fucking disaster, it's more just academic. If EMP/CPOP was falling, then it would be a disaster.
Isn't the gov't job just to stop the disaster, not to fix the markets? I thought job growth was the market's problem?
Why do I get the impression that some folks switch between "it's the gov'ts fault" and "the gov't should stay out of it" depending on how they can place the blame?
What is our goal, for the gov't to stay out of the way or for them to fix shit?
Why don't you just admit it, you don't really want to know why the EU fell or why the NILF increased? What you want is it to be the government's fault instead of the markets.
The reason that the EU fell, the NILF increased, employment to pop is flat, and every manner of things is because the free market isn't doing it's magic. Ain't nothing keeping it from doing it. The interest rates are low, there are plenty of people that would take a job it it was offered. And if they did, they would happily spend their earnings.
Why don't you just admit it, that's the answer your looking for. The answer is "nobody is perfect", "shit happens", "life sucks" and it is nobody's fault. And the only thing that you can take responsibility for is what you do.
If your gonna ask a fucking question, then take the fucking answer instead of changing the question because it's not the answer you like.
Pisses me off. That's why I don't take your questions all that seriously, because you change the question when you don't like the answer.
You answer the fucking question, why the EU rate can fall while employment to pop remains flat. How can it be that things are good, okay, and not good, both at the same time? It makes so fucking sense!! All the measures must all come to the same conclusion at the same time and every time, every single month and in the long run.
Does any of that answer you're ever changing question?


- Thread starter
- #391
JFK said:from Dec of 2011 to April of 2012 the not in number has grown all most 2 million people with 500k from march to April during the same time the civilian labor force has grown 400,000 Table A-1. Employment status of the civilian population by sex and age (Table A-1. Employment status of the civilian population by sex and age)
Those graphs will not reflect that explosion in which during the same time (from Nov 11) we have went from a 9% UE rate to a 8.1 All of your research will not reflect that. This has been my question from the start
How can the number of UE drop 500,000 in the same time period but the UE rate drop a full 1% *_Employment-population ratio_*
58.4 58.5 58.5 58.6 58.5 58.4
there is your answer
that rate has not dropped in a full year
only the not in rate has made the UE rate drop
You know, what really erks me is that you actually aren't interested in what the numbers spell out, just that you should prove some pre-determined position. That's the sense I'm getting.
You said, "My issue is and has been the not-in work force # is sky rocketing"
Now your question is otherwise, that it is "How can the number of UE drop?"
So suddenly, you don't like the answer so your changing the question.
My research is based on the entire BLS CPS data set which they are so kind as to provide on an ftp site. It can and does reflect exactly what is going on, including the "explosion" in which the UE rate went from 9% to 8.1%.
It would help if you would include the period of time and if you are referring to seasonally adjusted or unadjusted. It is impossible to speak to your numbers if you don't say what exactly they refer to.
I'm not contesting the fact that the April UE rate dropped on a decrease in the labor force.
The labor force falls all the time. It declined from July of 2011 to December of 2011, climbing again through March of 2012 then falling again in April.
I really couldn't careless about a particular month because a) I look an unadjusted numbers which are not seasonally adjusted and b) there is variance due to 1) seasonality and 2) randomness.
That's why I looked at the overall change from 2007 through 2012, to see what the trend has been. And the trend has been that, as pingy confirmed, 20-24 year old and 60-65 year old categories have been a major contributor to the over all increase in the NILF.
The over riding question is what the trend is, not what a particular month happened to be.
And the employment to population ratio has been fairly flat for two years. It's got this seasonal variation. It seems to have declined in 2010, ever so slightly, then increased, ever so slightly, in 2011. But the decline and increase are so slight as to be pretty meaningless.
That the employment to population ratio has been fairly flat tells us that the market has been adding jobs at least so fast as to keep up with population growth. Thank the markets for that much.
That the employment to population ratio has been flat is why we get into this whole question of exactly what is affecting the other numbers.
How can the UE ratio change, decrease or increase while employment remains flat? How can the NILF to CPOP increase while the employment to population ratio remains flat?
Is there some structural change going on? Is there a particular labor group that is being hit particularly hard?
And it seems that your getting all pissy about one statistic or another, now the UE rate, because you're looking for one statistic to prove something. Good for you, you've "proven" something. Woo hoo. Now you can run around screaming, "throw the bastards out?" Of course, you'll just end up with more bastards in the end with no clue what's really going on. Of course, you'll just end up with more bastards in the end with no clue what's really going on. You will just stick you're head in the sand, ignoring that you're bastards are as crappy as any others. But, if your are in denial, it all feels good.
But you said, "My issue is and has been the not-in work force # is sky rocketing" and two people have answered it the same 1) 20-24 year olds have increased it and 2) 65-69 year olds have increased it.
I find it particularly odd that the NILF/CPOP increased, the LF/CPOP decreased, and the EMP/CPOP has been flat.
But now you want to know "How can the number of UE drop?"
Well,
CPOP is UNEMP + EMP + NILF
LF is UNEMP + EMP
So, 1 = UNEMP/CPOP + EMP/CPOP + NILF/CPOP
1= LF/CPOP + NILF/CPOP
UE rate is Unemp/LF
E rate is Emp/LF
EU + E = 1
And my question is, how can EMP/CPOP remain constant whle EU falls?
The answer is in there somewhere.
And it might have something to do with this graph,
In order for employment to fall as a percentage of population while employment as a percentage is steady, the labor force as a percentage must decrease. It decreases because population is coming up underneath it.
That's all find, but it's not getting to EU as EU isn't over CPOP, it's over LF. And while LF/CPOP may necessarily decline, it doesn't mean that EU must.
But thankfully, EMP/CPOP is flat so it's not a fucking disaster, it's more just academic. If EMP/CPOP was falling, then it would be a disaster.
Isn't the gov't job just to stop the disaster, not to fix the markets? I thought job growth was the market's problem?
Why do I get the impression that some folks switch between "it's the gov'ts fault" and "the gov't should stay out of it" depending on how they can place the blame?
What is our goal, for the gov't to stay out of the way or for them to fix shit?
Why don't you just admit it, you don't really want to know why the EU fell or why the NILF increased? What you want is it to be the government's fault instead of the markets.
The reason that the EU fell, the NILF increased, employment to pop is flat, and every manner of things is because the free market isn't doing it's magic. Ain't nothing keeping it from doing it. The interest rates are low, there are plenty of people that would take a job it it was offered. And if they did, they would happily spend their earnings.
Why don't you just admit it, that's the answer your looking for. The answer is "nobody is perfect", "shit happens", "life sucks" and it is nobody's fault. And the only thing that you can take responsibility for is what you do.
If your gonna ask a fucking question, then take the fucking answer instead of changing the question because it's not the answer you like.
Pisses me off. That's why I don't take your questions all that seriously, because you change the question when you don't like the answer.
You answer the fucking question, why the EU rate can fall while employment to pop remains flat. How can it be that things are good, okay, and not good, both at the same time? It makes so fucking sense!! All the measures must all come to the same conclusion at the same time and every time, every single month and in the long run.
Does any of that answer you're ever changing question?
asshole?
boy that is mature
Your nonstop graphathon is pure babble
I was being polite
Okay, no more of that
The numbers are flawed
You are trying to explain why twice as many people are leaving the workforce as entering it with a bunch of shit that has NOTHING to do with that fact
ASSHOLE?
I been trying to get one of you left wing bomb throwers to actually answer one simple question
why is it during an election year were are removing 2 people from the work force to everyone we are adding
Do you need a graph to answer that?
you going to right another synopsis that has absolutely nothing to do with that?
BTW that is strike one and strike 2
You got no more class than to call people you dis agree with ass-hole, I have no place for that level of intelligence in my life
simple as i can make it for you
3 people
2 leave the work force numbers
1 enters it
we have an election in about 27 weeks
For ever job we create, we create another one in the UE rate by doing this
Now graph that, and try to use some algebra if you want to look smart in the future, or you can just continue to think you smarter than the rest of us
Last edited:
itfitzme
VIP Member
Yes we are in trouble the left seems to think we aren't.Thank you
The Employment to population ratio has actually the same in the last 12 months
I have been stating this for a while now and it has been ignored
The media has covered this phenom some, but this is THE story about job growth
We are not creating any jobs
take out Texas
La
Oklahoma
ND
SD
we are in real trouble and what is it they all have in common?
There still talking about the baby boom as it has something to do with, well I do not know that there point is
I guess there trying to spin this data to state that the reason the not-in data is a reflection of baby boomers?
Its all over the place
There is a simple way to resolve problems in life and especially in business
why is the UE rate dropping when we are adding so few jobs??
Because the civilian labor force is not growing and has actually shrunk 500k in the last 2 months
Civilian noninstitutional population
239,146 one year 242,784
Civilian labor force
153,420 one year 154,365
the rest has went into the not-in list
85,726 one year 88,419
Employment-population ratio
58.4 one year 58.4
we have created 0 jobs in the last year in reality as there has been well over twice as many people left the work force than has entered it
all this means is there is your lowering the UE rate by subtracting those who have left the work force, not really adding jobs
And what baby boomers has to with that is not to the level we are seeing, not even close
Even if it was 100%, there is still no jobs being created
See, now your spinning things.
You say, "The Employment to population ratio has actually the same in the last 12 month"
Then you say, "we have created 0 jobs in the last year"
Which is it, either jobs have been added at a rate to keep up with pop or they haven't. You cannot have it both ways.
- Thread starter
- #393
Yes we are in trouble the left seems to think we aren't.
There still talking about the baby boom as it has something to do with, well I do not know that there point is
I guess there trying to spin this data to state that the reason the not-in data is a reflection of baby boomers?
Its all over the place
There is a simple way to resolve problems in life and especially in business
why is the UE rate dropping when we are adding so few jobs??
Because the civilian labor force is not growing and has actually shrunk 500k in the last 2 months
Civilian noninstitutional population
239,146 one year 242,784
Civilian labor force
153,420 one year 154,365
the rest has went into the not-in list
85,726 one year 88,419
Employment-population ratio
58.4 one year 58.4
we have created 0 jobs in the last year in reality as there has been well over twice as many people left the work force than has entered it
all this means is there is your lowering the UE rate by subtracting those who have left the work force, not really adding jobs
And what baby boomers has to with that is not to the level we are seeing, not even close
Even if it was 100%, there is still no jobs being created
See, now your spinning things.
You say, "The Employment to population ratio has actually the same in the last 12 month"
Then you say, "we have created 0 jobs in the last year"
Which is it, either jobs have been added at a rate to keep up with pop or they haven't. You cannot have it both ways.
Spin was not my intent. My intent was to show that the UE rate has fallen well over 1% in the last 12 months, yet the rate of employment to the population is unchanged
Does it not make sense those leaving the work force for what ever reason is the only reason the UE rate has fallen?
Creating jobs to me means when the 6 million people that lost there jobs in 08-09 get back to 0, then we will have begun to create jobs
Keeping pace with the masses is not creation, it is by definition idle at best
2000...... 131,785 110,995 24,649 599 6,787 17,263
2001...... 131,826 110,708 23,873 606 6,826 16,441
2002...... 130,341 108,828 22,557 583 6,716 15,259
2003...... 129,999 108,416 21,816 572 6,735 14,509
2004...... 131,435 109,814 21,882 591 6,976 14,315
2005...... 133,703 111,899 22,190 628 7,336 14,227
2006...... 136,086 114,113 22,530 684 7,691 14,155
2007...... 137,598 115,380 22,233 724 7,630 13,879
2008...... 136,790 114,281 21,335 767 7,162 13,406
2009...... 130,807 108,252 18,558 694 6,016 11,847
2010...... 129,874 107,384 17,751 705 5,518 11,528
2011...... 131,359 109,254 18,021 784 5,504 11,733
ftp://ftp.bls.gov/pub/suppl/empsit.ceseeb1.txt
we are not there yet according to this data as noted below
B-1. Employees on nonfarm payrolls by major industry sector, 1962 to date
- Thread starter
- #394
The mass media pro tray's job growth as the UE rate falling or a number of jobs added. In there defense some have reported that we have had no real job growth from late 2008, early 2009.
But the headline has been 9 to 8.6, now to 8.1 an by election it will be below 8%. People know better. the same masses that lost there jobs in 2008 late and most all of 2009 by the numbers are still UE. All we have done is remove close to 3 million people from the active work force in just 1 year, by doing this it lowers the number of people UE by some margin, hence it looks like a job was created
In Texas there is work, I will travel 1300 miles this week to go back to work, in Texas
There are only 5-7 states in which there is any real job growth,all of it has to do with oil and or natural gas
edthecynic
Censored for Cynicism
- Oct 20, 2008
- 43,044
- 6,883
- 1,830
Because from that same April 2011 to April 2012 period the number of employed increased over 2 million.The argument that ensued was whether people retiring has been a major contributor to the increase in the "not in labor force".
The BLS CPS provides an overwhelming number of categories including categories grouped every five years of age, from 16 to over 75.
Finding the best way to deal with decades of data for a dozen categories took some trial and error. I finally settled on simply the percentage change in total numbers from April 2007 to April 2012.
The reason for choosing April is that seasonal variation makes it prudent to use the same month. And, as the last data is for April 2012, then April makes sense.
Because the recession began Dec '07, I bracketed it an present the change from both '07 and '08.
Here are the total percent changes;
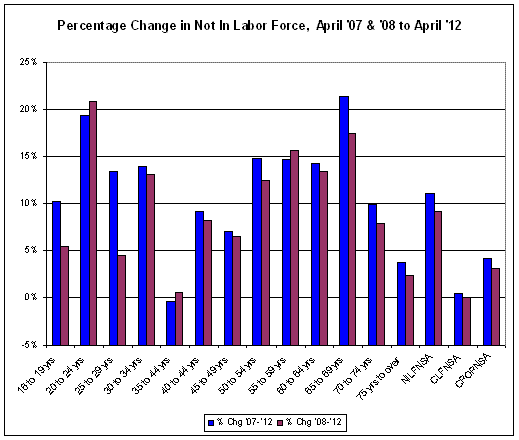
The changes in the Civilian Non-institutionalized Population, Total Not In Labor Force, and Civilian Labor Force are shown for reference.
Here is how this works. All other things being perfectly stable and normal, then all age categories would increase exactly the same as the CNIP, the NILF, and the CLF. Everything would increase the same.
If the category is more then CNIP, it has increased excessively. If it is less then CNIP, it has decreased compared to what is expected.
That NILF has increased more then CNIP, indicates that it has increased more then it would had things been normal.
The comparison between an age category and the total NILF is significant. If the age category change is higher, then there has been a significant net increase over what would be expected.
Looking at the 65 to 70 year increase, it is larger then the NILF. It is also the largest of all contributors to the increase in the NILF.This supports the contention that retirees have substantially increased the NILF.
The second largest contributor has been the 20 to 24 year old category. This supports a contention that high school graduates are finding a job market that is hiring experienced workers.
Another factor is simply resources. Workers of retirement age have the opportunity, lacking the availability of a job, to draw on retirement. High school graduates, lacking the availability of a job, are in the position to remain at home.
from Dec of 2011 to April of 2012 the not in number has grown all most 2 million people with 500k from march to April
during the same time the civilian labor force has grown 400,000
Table A-1. Employment status of the civilian population by sex and age
Those graphs will not reflect that explosion in which during the same time (from Nov 11) we have went from a 9% UE rate to a 8.1
All of your research will not reflect that. This has been my question from the start
How can the number of UE drop 500,000 in the same time period but the UE rate drop a full 1%
Employment-population ratio
58.4 58.5 58.5 58.6 58.5 58.4
there is your answer
that rate has not dropped in a full year
only the not in rate has made the UE rate drop
itfitzme
VIP Member
There still talking about the baby boom as it has something to do with, well I do not know that there point is
I guess there trying to spin this data to state that the reason the not-in data is a reflection of baby boomers?
Its all over the place
There is a simple way to resolve problems in life and especially in business
why is the UE rate dropping when we are adding so few jobs??
Because the civilian labor force is not growing and has actually shrunk 500k in the last 2 months
Civilian noninstitutional population
239,146 one year 242,784
Civilian labor force
153,420 one year 154,365
the rest has went into the not-in list
85,726 one year 88,419
Employment-population ratio
58.4 one year 58.4
we have created 0 jobs in the last year in reality as there has been well over twice as many people left the work force than has entered it
all this means is there is your lowering the UE rate by subtracting those who have left the work force, not really adding jobs
And what baby boomers has to with that is not to the level we are seeing, not even close
Even if it was 100%, there is still no jobs being created
See, now your spinning things.
You say, "The Employment to population ratio has actually the same in the last 12 month"
Then you say, "we have created 0 jobs in the last year"
Which is it, either jobs have been added at a rate to keep up with pop or they haven't. You cannot have it both ways.
Spin was not my intent. My intent was to show that the UE rate has fallen well over 1% in the last 12 months, yet the rate of employment to the population is unchanged
Does it not make sense those leaving the work force for what ever reason is the only reason the UE rate has fallen?
Creating jobs to me means when the 6 million people that lost there jobs in 08-09 get back to 0, then we will have begun to create jobs
Keeping pace with the masses is not creation, it is by definition idle at best
2000...... 131,785 110,995 24,649 599 6,787 17,263
2001...... 131,826 110,708 23,873 606 6,826 16,441
2002...... 130,341 108,828 22,557 583 6,716 15,259
2003...... 129,999 108,416 21,816 572 6,735 14,509
2004...... 131,435 109,814 21,882 591 6,976 14,315
2005...... 133,703 111,899 22,190 628 7,336 14,227
2006...... 136,086 114,113 22,530 684 7,691 14,155
2007...... 137,598 115,380 22,233 724 7,630 13,879
2008...... 136,790 114,281 21,335 767 7,162 13,406
2009...... 130,807 108,252 18,558 694 6,016 11,847
2010...... 129,874 107,384 17,751 705 5,518 11,528
2011...... 131,359 109,254 18,021 784 5,504 11,733
ftp://ftp.bls.gov/pub/suppl/empsit.ceseeb1.txt
we are not there yet according to this data as noted below
B-1. Employees on nonfarm payrolls by major industry sector, 1962 to date
Look, I am very careful in my selection of words because other people have an understanding of what the words mean that is not defined according to what I want the words to me. Jobs being added is jobs being added. A flat employment to population ratio is a flat employment to population ratio and it is jobs being added at the rate of the population increase.
I agree, a flat employment to population while we are still above the natural UE rate of 5% surely is "idle". I get that and I have repeatedly said that emp/pop is flat. But it also isn't declining, and jobs are being added.
You point to the NILF increasing, which no one contests, and I go after why it is increasing.
But when you present a point of focus, reject the facts presented, change the question or focus, use words in a manner that is not the common definition, you gotta expect it's gonna piss someone off. It's hard enough to keep all this shit clear in mind without someone pissing all over solid reasoning.
You point out that the UE seems to be decreasing on an increasing NILF, then I'll go look at that. I ain't there yet and I haven't seen all the possibilities ironed out.
That the UE rate is decreasing is because either the unemployment is decreasing or the labor force is increasing, right? (is LF increasing? I don't remember. Can NILF increase while LF increases? Sure, population increases?)
Unemployment rate is the number of unemployed people divided by the labor force.
And I get the idea that the number of unemployed can decrease because people left the the rank of the labor force. But once we realize that, we also realize that this also means the the labor force, in the denominator decreases as well. It doesn't by the same amount, but the thing then opens up the whole issue that the UE rate is a bit fuzzy.
Sure, it can be simply that a shit load of people are getting discouraged and simply giving up. Hey, trust me, I know, I really know, okay? And those are entering the NILF.
So we start asking, why is the NILF increasing? Is is all just because of people leaving the LF? Well, it appears that one reason is that younger folks are entering the NILF force and not finding jobs and people of age 65 are retiring and exiting the LF.
So the NILF is increasing can be because the population growth is adding to it without the few folks even entering the labor force.
Then of course, the whole thing is churning. A decrease in LF isn't just those leaving. It is more than those leaving minus some less entering. But I'm not even ready to tackle that one or if it is even important.
In my experience, if we can think of a half dozen possibilities, it is generally that they are all in play. The most likely scenario is that the NILF is increasing because both new population and LF exits. And that is what the data suggests.
But, having looked at it in some detail surrounding the per population numbers, it also can be for simply odd mathematical reasons. I'm not saying it is, just that it is possible.
And then, fundamentally, I don't like the /LF numbers anyways. Per CPOP is much cleaner. the /LF numbers are fine when /LF is stable. But it isn't stable right now.
At least we have some solid footing to stand of with employment per population. That can't go wrong. We get that jobs better increase at least so much as to keep that ratio flat.
Understanding how it makes sense that UE is decreasing while emp to pop is flat is a damned interesting question.
That's why I presented the equations and that /CPOP graph. It happens that, for the /CPOP ratios, there is something odd that happens when emp/CPOP is flat. CPOP is coming up underneath it all, so for emp/CPO to be flat and Unemp/CPOP to decrease, LF/CPOP must go down. It is really interesting. With regard to the /LF set, frankly, I don't know yet. I'm still working on how to separate out the individual effects in a manner that is clear. It just gets odd when dealing with ratios where the underlying baseline is changing. For one thing, it isn't intuitive. We are not use to ratios with a changing denominator.
Here is a possibility, both Unemp/CPOP and LF/CPOP both decreased at the same time.
The UE rate is (Unemp/CPOP)/(LF/CPOP). CPOP cancels and we get a simpler formula. But, fundamentally, what we have for a reference is CPOP and everything better be increasing proportionally. If we look at Unemp/CPOP and LF/CPOP separately, we find that both fell fro March to April.
Now that's interesting, a weird situation. See, that's why I don't really like /LF numbers. If we are looking over the history of labor utilization, LF has changed dramatically on structural changes (women, particularly in the early 70's and on). /LF factors out structural changes.
It seems like we have some weird shit happening that kind of messes up the stability of the numbers. 20-24 year olds are not finding jobs. People are retiring. The structure of the labor force is changing. Jobs are being created only so fast as population growth.
It's like any statement that can be made is true, in part. Yeah, the LF dropped on people leaving. Yeah, NILF increased on both increased pop without sufficient jobs to take them all while LF retirees added to it. On the other hand, 30-35 year olds are finding work. They are not to young, not to old.
And it is all happening on a backdrop of seasonal variation.
All in all, it's not just one single thing. It's a combination of things.
So here are the numbers for /LFs and /CPOPs
Date...........LftoCPOP..UnempToCPOP...UnempToLF... EmpToCPOP...EmpToLF
4/1/2012.....63.39%.......4.91%...............7.74%...............58.49%......92.26%
3/1/2012.....63.61%.......5.32%...............8.36%...............58.29%......91.64%
2/1/2012.....63.57%.......5.54%...............8.71%...............58.03%......91.29%
1/1/2012.....63.35%.......5.59%...............8.82%...............57.76%......91.18%
You should see how the LF to CPOP looks over the long run. Not good. In truth, due to the large seasonal variability, just four months isn't the best way to look at it.
Just looking at those numbers, the odd man out is LF/CPOP.
It all just leaves me all that more suspicious of LF and /LF stuff. Without futzing around with the equations, I'm not sure what the f' it really means these days. Not with LF/CPOP falling.
I agree, it's really friggin' odd. But I usually have found that when it's really odd, it ends up being just some funny math thing, not something nefarious.
And it bring me back to that LF/CPOP must fall in order for Emp/CPOP to be flat while Unemp/CPOP decreases.
If LF is increasing and it's all going into an increasing Emp, the Unemp/LF would decrease too. Same as it would if LF was decreasing on exits from Unemp.
What we really want is people leaving Unemp and going to Emp while LF stays constant. That's what makes sense intuitively. But that isn't what is happening, ever. What is happening is Emp, Unem, LF, and CPOP are all changing along with NILF.
The only thing I can come up with is, and it is demonstrated, that if Emp/CPOP is constant and Unemp/CPOP falls, then LF/CPOP must fall. In the same manner, Unemp/CPOP can fall with a bit of an increase in Emp/CPOP and LF/CPOP can also fall.
And it isn't that LF level is decreasing, just that isn't increasing at the same rate as CPOP.
In case of this last April, LF did decrease a bit. And so here is the thing, LF decreasing is it not increasing at the same rate as CPOP. So the same effect occurs. (I'm just thinking here.) I'm not seeing if this translates well to the /LFs.
All that said, here is the levels for the last four months.
Date .....UnempNSA CLFNSA CPOPNSA EmpLevelNSA
4/1/2012 11910 153905 242784 141995
3/1/2012 12904 154316 242604 141412
2/1/2012 13430 154114 242435 140684
1/1/2012 13541 153485 242269 139944
And yeah, LF did fall for March to April. And, so far, I am not terribly surprised. How many times has this happened? How many times has the weird, only LF/CPOP occurred and we just didn't notice? Any one care to search the data for it?
That's the odd man out, that LF falling March to April. But it's relative. Maybe it's a single instance of a data error. (Not my preferred explanation.)
More likely, this particular month, it actually fell on more people leaving the LF then joined. I just can't come up with a solid reason for caring if one month, with large numbers of people coming and going, if it is anything but that sooner or later, it's gotta happen.
What is that, Unemp fell by 1 mill while LF fell by 400k? So UE fell on both Unemp and LF levels, where Unemp fell more then LF. I mean , if it was just exists from LF, then Unemp and LF would fall the same amount for a falling UE. Right?
So, to your main question, "the UE rate has fallen well over 1% in the last 12 months, yet the rate of employment to the population is unchanged Does it not make sense those leaving the work force for what ever reason is the only reason the UE rate has fallen?"
The answer is, actually yes, just not intuitively and not on initial inspection. Emp/POP and Unemp/LF are only marginally related.
I'd have to figure out how they are related in order to show why it isn't completely non-sense.
LF = Emp + Unemp
We can divide it all by POP
LF/POP = Emp/POP + Unemp/POP
And I'm back to that graph. If emp/POP is flat and Unemp/POP decreases, then LF/POP must decrease. It couldn't happen any other way. And if LF is basically flat, then it is POP coming up underneath. LF could fall a tad, emp/pop remain flat, and Unemp/POP fall even more.
Right now, it's all I got for that issue. I'm not sure how to relate the two to see how it can occur. It is all about coming up with some algebra expression that relates Emp/POP to Unemp/LF. Without some expression, we just can't pin it down. But, perhaps, that is the issue, they are not as related as one would intuitively expect.
- Thread starter
- #397
Because from that same April 2011 to April 2012 period the number of employed increased over 2 million.The argument that ensued was whether people retiring has been a major contributor to the increase in the "not in labor force".
The BLS CPS provides an overwhelming number of categories including categories grouped every five years of age, from 16 to over 75.
Finding the best way to deal with decades of data for a dozen categories took some trial and error. I finally settled on simply the percentage change in total numbers from April 2007 to April 2012.
The reason for choosing April is that seasonal variation makes it prudent to use the same month. And, as the last data is for April 2012, then April makes sense.
Because the recession began Dec '07, I bracketed it an present the change from both '07 and '08.
Here are the total percent changes;
The changes in the Civilian Non-institutionalized Population, Total Not In Labor Force, and Civilian Labor Force are shown for reference.
Here is how this works. All other things being perfectly stable and normal, then all age categories would increase exactly the same as the CNIP, the NILF, and the CLF. Everything would increase the same.
If the category is more then CNIP, it has increased excessively. If it is less then CNIP, it has decreased compared to what is expected.
That NILF has increased more then CNIP, indicates that it has increased more then it would had things been normal.
The comparison between an age category and the total NILF is significant. If the age category change is higher, then there has been a significant net increase over what would be expected.
Looking at the 65 to 70 year increase, it is larger then the NILF. It is also the largest of all contributors to the increase in the NILF.This supports the contention that retirees have substantially increased the NILF.
The second largest contributor has been the 20 to 24 year old category. This supports a contention that high school graduates are finding a job market that is hiring experienced workers.
Another factor is simply resources. Workers of retirement age have the opportunity, lacking the availability of a job, to draw on retirement. High school graduates, lacking the availability of a job, are in the position to remain at home.
from Dec of 2011 to April of 2012 the not in number has grown all most 2 million people with 500k from march to April
during the same time the civilian labor force has grown 400,000
Table A-1. Employment status of the civilian population by sex and age
Those graphs will not reflect that explosion in which during the same time (from Nov 11) we have went from a 9% UE rate to a 8.1
All of your research will not reflect that. This has been my question from the start
How can the number of UE drop 500,000 in the same time period but the UE rate drop a full 1%
Employment-population ratio
58.4 58.5 58.5 58.6 58.5 58.4
there is your answer
that rate has not dropped in a full year
only the not in rate has made the UE rate drop
There are 2 people leaving to every one entering
That 2 million number has a certain amount within it that fact that are being counted as new jobs when actually all there doing is being removed from the UE list
There is a few jobs being created. Almost 100% from the Oil and Gas sector (that is were I am headed, 1300 miles away from home) but not the numbers we are being given
- Thread starter
- #398
See, now your spinning things.
You say, "The Employment to population ratio has actually the same in the last 12 month"
Then you say, "we have created 0 jobs in the last year"
Which is it, either jobs have been added at a rate to keep up with pop or they haven't. You cannot have it both ways.
Spin was not my intent. My intent was to show that the UE rate has fallen well over 1% in the last 12 months, yet the rate of employment to the population is unchanged
Does it not make sense those leaving the work force for what ever reason is the only reason the UE rate has fallen?
Creating jobs to me means when the 6 million people that lost there jobs in 08-09 get back to 0, then we will have begun to create jobs
Keeping pace with the masses is not creation, it is by definition idle at best
2000...... 131,785 110,995 24,649 599 6,787 17,263
2001...... 131,826 110,708 23,873 606 6,826 16,441
2002...... 130,341 108,828 22,557 583 6,716 15,259
2003...... 129,999 108,416 21,816 572 6,735 14,509
2004...... 131,435 109,814 21,882 591 6,976 14,315
2005...... 133,703 111,899 22,190 628 7,336 14,227
2006...... 136,086 114,113 22,530 684 7,691 14,155
2007...... 137,598 115,380 22,233 724 7,630 13,879
2008...... 136,790 114,281 21,335 767 7,162 13,406
2009...... 130,807 108,252 18,558 694 6,016 11,847
2010...... 129,874 107,384 17,751 705 5,518 11,528
2011...... 131,359 109,254 18,021 784 5,504 11,733
ftp://ftp.bls.gov/pub/suppl/empsit.ceseeb1.txt
we are not there yet according to this data as noted below
B-1. Employees on nonfarm payrolls by major industry sector, 1962 to date
Look, I am very careful in my selection of words because other people have an understanding of what the words mean that is not defined according to what I want the words to me. Jobs being added is jobs being added. A flat employment to population ratio is a flat employment to population ratio and it is jobs being added at the rate of the population increase.
I agree, a flat employment to population while we are still above the natural UE rate of 5% surely is "idle". I get that and I have repeatedly said that emp/pop is flat. But it also isn't declining, and jobs are being added.
You point to the NILF increasing, which no one contests, and I go after why it is increasing.
But when you present a point of focus, reject the facts presented, change the question or focus, use words in a manner that is not the common definition, you gotta expect it's gonna piss someone off. It's hard enough to keep all this shit clear in mind without someone pissing all over solid reasoning.
You point out that the UE seems to be decreasing on an increasing NILF, then I'll go look at that. I ain't there yet and I haven't seen all the possibilities ironed out.
That the UE rate is decreasing is because either the unemployment is decreasing or the labor force is increasing, right? (is LF increasing? I don't remember. Can NILF increase while LF increases? Sure, population increases?)
Unemployment rate is the number of unemployed people divided by the labor force.
And I get the idea that the number of unemployed can decrease because people left the the rank of the labor force. But once we realize that, we also realize that this also means the the labor force, in the denominator decreases as well. It doesn't by the same amount, but the thing then opens up the whole issue that the UE rate is a bit fuzzy.
Sure, it can be simply that a shit load of people are getting discouraged and simply giving up. Hey, trust me, I know, I really know, okay? And those are entering the NILF.
So we start asking, why is the NILF increasing? Is is all just because of people leaving the LF? Well, it appears that one reason is that younger folks are entering the NILF force and not finding jobs and people of age 65 are retiring and exiting the LF.
So the NILF is increasing can be because the population growth is adding to it without the few folks even entering the labor force.
Then of course, the whole thing is churning. A decrease in LF isn't just those leaving. It is more than those leaving minus some less entering. But I'm not even ready to tackle that one or if it is even important.
In my experience, if we can think of a half dozen possibilities, it is generally that they are all in play. The most likely scenario is that the NILF is increasing because both new population and LF exits. And that is what the data suggests.
But, having looked at it in some detail surrounding the per population numbers, it also can be for simply odd mathematical reasons. I'm not saying it is, just that it is possible.
And then, fundamentally, I don't like the /LF numbers anyways. Per CPOP is much cleaner. the /LF numbers are fine when /LF is stable. But it isn't stable right now.
At least we have some solid footing to stand of with employment per population. That can't go wrong. We get that jobs better increase at least so much as to keep that ratio flat.
Understanding how it makes sense that UE is decreasing while emp to pop is flat is a damned interesting question.
That's why I presented the equations and that /CPOP graph. It happens that, for the /CPOP ratios, there is something odd that happens when emp/CPOP is flat. CPOP is coming up underneath it all, so for emp/CPO to be flat and Unemp/CPOP to decrease, LF/CPOP must go down. It is really interesting. With regard to the /LF set, frankly, I don't know yet. I'm still working on how to separate out the individual effects in a manner that is clear. It just gets odd when dealing with ratios where the underlying baseline is changing. For one thing, it isn't intuitive. We are not use to ratios with a changing denominator.
Here is a possibility, both Unemp/CPOP and LF/CPOP both decreased at the same time.
The UE rate is (Unemp/CPOP)/(LF/CPOP). CPOP cancels and we get a simpler formula. But, fundamentally, what we have for a reference is CPOP and everything better be increasing proportionally. If we look at Unemp/CPOP and LF/CPOP separately, we find that both fell fro March to April.
Now that's interesting, a weird situation. See, that's why I don't really like /LF numbers. If we are looking over the history of labor utilization, LF has changed dramatically on structural changes (women, particularly in the early 70's and on). /LF factors out structural changes.
It seems like we have some weird shit happening that kind of messes up the stability of the numbers. 20-24 year olds are not finding jobs. People are retiring. The structure of the labor force is changing. Jobs are being created only so fast as population growth.
It's like any statement that can be made is true, in part. Yeah, the LF dropped on people leaving. Yeah, NILF increased on both increased pop without sufficient jobs to take them all while LF retirees added to it. On the other hand, 30-35 year olds are finding work. They are not to young, not to old.
And it is all happening on a backdrop of seasonal variation.
All in all, it's not just one single thing. It's a combination of things.
So here are the numbers for /LFs and /CPOPs
Date...........LftoCPOP..UnempToCPOP...UnempToLF... EmpToCPOP...EmpToLF
4/1/2012.....63.39%.......4.91%...............7.74%...............58.49%......92.26%
3/1/2012.....63.61%.......5.32%...............8.36%...............58.29%......91.64%
2/1/2012.....63.57%.......5.54%...............8.71%...............58.03%......91.29%
1/1/2012.....63.35%.......5.59%...............8.82%...............57.76%......91.18%
You should see how the LF to CPOP looks over the long run. Not good. In truth, due to the large seasonal variability, just four months isn't the best way to look at it.
Just looking at those numbers, the odd man out is LF/CPOP.
It all just leaves me all that more suspicious of LF and /LF stuff. Without futzing around with the equations, I'm not sure what the f' it really means these days. Not with LF/CPOP falling.
I agree, it's really friggin' odd. But I usually have found that when it's really odd, it ends up being just some funny math thing, not something nefarious.
And it bring me back to that LF/CPOP must fall in order for Emp/CPOP to be flat while Unemp/CPOP decreases.
If LF is increasing and it's all going into an increasing Emp, the Unemp/LF would decrease too. Same as it would if LF was decreasing on exits from Unemp.
What we really want is people leaving Unemp and going to Emp while LF stays constant. That's what makes sense intuitively. But that isn't what is happening, ever. What is happening is Emp, Unem, LF, and CPOP are all changing along with NILF.
The only thing I can come up with is, and it is demonstrated, that if Emp/CPOP is constant and Unemp/CPOP falls, then LF/CPOP must fall. In the same manner, Unemp/CPOP can fall with a bit of an increase in Emp/CPOP and LF/CPOP can also fall.
And it isn't that LF level is decreasing, just that isn't increasing at the same rate as CPOP.
In case of this last April, LF did decrease a bit. And so here is the thing, LF decreasing is it not increasing at the same rate as CPOP. So the same effect occurs. (I'm just thinking here.) I'm not seeing if this translates well to the /LFs.
All that said, here is the levels for the last four months.
Date .....UnempNSA CLFNSA CPOPNSA EmpLevelNSA
4/1/2012 11910 153905 242784 141995
3/1/2012 12904 154316 242604 141412
2/1/2012 13430 154114 242435 140684
1/1/2012 13541 153485 242269 139944
And yeah, LF did fall for March to April. And, so far, I am not terribly surprised. How many times has this happened? How many times has the weird, only LF/CPOP occurred and we just didn't notice? Any one care to search the data for it?
That's the odd man out, that LF falling March to April. But it's relative. Maybe it's a single instance of a data error. (Not my preferred explanation.)
More likely, this particular month, it actually fell on more people leaving the LF then joined. I just can't come up with a solid reason for caring if one month, with large numbers of people coming and going, if it is anything but that sooner or later, it's gotta happen.
What is that, Unemp fell by 1 mill while LF fell by 400k? So UE fell on both Unemp and LF levels, where Unemp fell more then LF. I mean , if it was just exists from LF, then Unemp and LF would fall the same amount for a falling UE. Right?
So, to your main question, "the UE rate has fallen well over 1% in the last 12 months, yet the rate of employment to the population is unchanged Does it not make sense those leaving the work force for what ever reason is the only reason the UE rate has fallen?"
The answer is, actually yes, just not intuitively and not on initial inspection. Emp/POP and Unemp/LF are only marginally related.
I'd have to figure out how they are related in order to show why it isn't completely non-sense.
LF = Emp + Unemp
We can divide it all by POP
LF/POP = Emp/POP + Unemp/POP
And I'm back to that graph. If emp/POP is flat and Unemp/POP decreases, then LF/POP must decrease. It couldn't happen any other way. And if LF is basically flat, then it is POP coming up underneath. LF could fall a tad, emp/pop remain flat, and Unemp/POP fall even more.
Right now, it's all I got for that issue. I'm not sure how to relate the two to see how it can occur. It is all about coming up with some algebra expression that relates Emp/POP to Unemp/LF. Without some expression, we just can't pin it down. But, perhaps, that is the issue, they are not as related as one would intuitively expect.
okay
For another look at March-April, let's go to a BLS research series: Labor Force Flows
We see that of the 87,897,000 people Not in the Labor Force in March, 3,515,000 looked for and found work (or had looked months before, stopped looking but were finally hired from the older application), 2,761,000 started looking (unsuccessfully) for work, 81,433,000 stayed Not in the Labor Force, and 189,000 left the population (died, emmigrated, went to jaii or nursing home or the military).
At the same time, 3,993,000 people went from Employed to Not in the Labor Force. Some retired, some stayed home to look after the kids, some just hadn't started looking for work yet. 2,686,000 unemployed stopped looking for work, and 306,000 immigrated without work, or (mostly) turned 16 without working or looking for work, or otherwise entered the population as Not in the Labor Force.
Interesting point: 2,010,000 people went from Employed to Unemployed, but 2,272,000 went from Unemployed to Employed.
Another interesting point: While many are claiming the increase in NILF is due to people "giving up," more of the gross change into NILF was from Employed. Less than half the people going into NILF "stopped looking."
- Thread starter
- #400
For another look at March-April, let's go to a BLS research series: Labor Force Flows
We see that of the 87,897,000 people Not in the Labor Force in March, 3,515,000 looked for and found work (or had looked months before, stopped looking but were finally hired from the older application), 2,761,000 started looking (unsuccessfully) for work, 81,433,000 stayed Not in the Labor Force, and 189,000 left the population (died, emmigrated, went to jaii or nursing home or the military).
At the same time, 3,993,000 people went from Employed to Not in the Labor Force. Some retired, some stayed home to look after the kids, some just hadn't started looking for work yet. 2,686,000 unemployed stopped looking for work, and 306,000 immigrated without work, or (mostly) turned 16 without working or looking for work, or otherwise entered the population as Not in the Labor Force.
Interesting point: 2,010,000 people went from Employed to Unemployed, but 2,272,000 went from Unemployed to Employed.
(How many of the UE went to the not in cat)
Another interesting point: While many are claiming the increase in NILF is due to people "giving up," more of the gross change into NILF was from Employed. Less than half the people going into NILF "stopped looking."
Good Information
The not-in number went up 500,000 in April
Similar threads
- Replies
- 69
- Views
- 2K
- Replies
- 6
- Views
- 123
- Replies
- 37
- Views
- 1K
- Replies
- 46
- Views
- 898
Latest Discussions
- Replies
- 40
- Views
- 300
- Replies
- 24
- Views
- 144
- Replies
- 2
- Views
- 3
- Replies
- 50
- Views
- 218
Forum List
-
-
-
-
-
Political Satire 8302
-
-
-
-
-
-
-
-
-
-
-
-
-
-
-
-
-
-
-
ObamaCare 781
-
-
-
-
-
-
-
-
-
-
-
Member Usernotes 477
-
-
-
-
-
-
-
-
-
-