
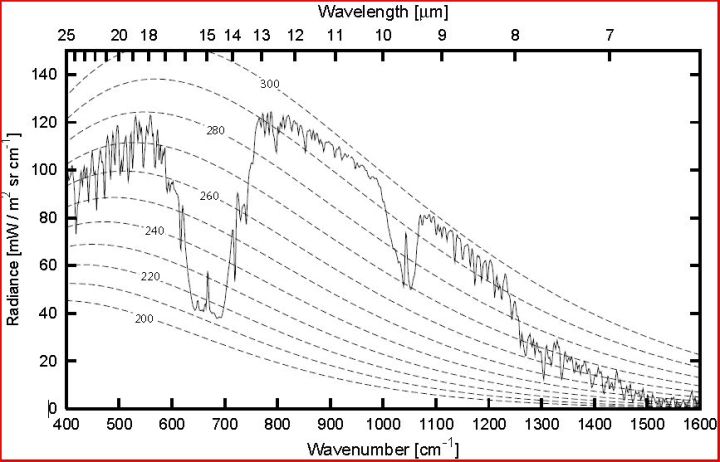
here is a useful graph that packs a lot of information. for one it gives both the wavelength and the wavenumber. it shows the amount of radiation emitted at the top of the atmosphere but I am not sure for which year. it still gives the general idea. notice that it gives dotted lines for (blackbody) Planck curves at different temperatures.
AGW is concerned with CO2, and CO2 absorption of 15 micron IR. if you look at the graph you will see what appears to be a large chunk taken out, centered on 15 microns. that is the CO2 fingerprint. no 15 micron IR escapes from the surface, it is all absorbed and converted to heat or energy to power other pathways. but there is still some getting out according to the graph. that is where the Planck curves come in. the amount of power radiated at 15 microns is equivalent to a BB at 215K (about -60C). this means that the radiation comes (on average) from an altitude in the atmosphere that is at -60C, a point where the lower density of air and CO2 allows the radiation to escape rather than simply be absorbed and transformed into something else.
at the surface 99.99% of 15 micron IR is absorbed in the atmosphere at 10 meters. 95% is absorbed at one meter. I wish I had the info for 1cm and 1mm. perhaps on the order of 50% and 25%? the surface boundary is a special case where most of the action in radiative transfers take place. the cloud tops are another boundary but only a faint echo.
the so called greenhouse effect is real. the calculated response for doubling CO2 is roughly 1C at the surface. this is the majority view of most skeptics and lukewarmers. what us 'deniers' contest are the supposed feedbacks that multiply that 1C into 3C, or more. what we really deny are the exaggerated propheses of doom and catastrope coming from the original 1C warming. and the last 20 years of data show that our vision agrees with reality much more closely than the warmers predictions.