Where is the confession?

I most certainly can. You forget how young we are. Homo Sapiens only became dominant some 200,000 years ago.

I most certainly can.

No you can't.

You forget how young we are. Homo Sapiens only became dominant some 200,000 years ago.


And that's proof changes in the past haven't been as fast or faster?
 
It's been a couple of degrees warmer and a couple of degrees colder during our human civilization.

In the last five centuries, the average temperature has varied by less than half a degree. Human infrastructure was built based on that stable temperature.

That is, your stupid conclusion is based on your ignorance of the facts.

I can see why libs like the idea.

You consistent failure at all the science, logic and history does not reflect badly on us.

You logic failure here is especially amusing. You're the one who wants to spend money changing the atmosphere, while we want to minimize any changes. You say changing the atmosphere is bad, so by your own standards, your argument that we need to change the atmosphere stinks. Your argument is self-contradicting. And if you'd stop hanging out with such a rationality-challenged crowd of conservatives, someone would have pointed that out to you long ago.

In the last five centuries, the average temperature has varied by less than half a degree. Human infrastructure was built based on that stable temperature.

We're not as delicate as you fear.
Day-night temp swings are much larger.
Winter-summer swings, larger still.
Why would an increase of 1 or 2 degrees suddenly damage our infrastructure?
Is that the sum of your proof that warmer is worse? That a bit cooler is the perfect range?

You're the one who wants to spend money changing the atmosphere,

How do you figure that?

You say changing the atmosphere is bad

Where did I say that?
 
So if a 3C increase actually increases crop yields, you still want to spend trillions in a futile attempt to stop it,
because change is bad?

If you think increased crop yields are worth the harm we will suffer from a rapid 3C temperature increase, you're out of your fucking mind.

Increased crop yields, fewer deaths in winter, less disease.

What harm will we suffer? Why will it increase 3C?
 
Who invented data? Who admitted inventing data? Have you got a paper that refutes the conclusions of MBH 98?

The man admitted inventing data crick.....why on earth would you continue to try to defend him....it is not defendable....he admitted it....go into court with the best lawyer on earth and admit to the crime and even the best lawyer is done...an admission is an admission....there is no question...he said he did it.....how do you think you can ever change that fact?

Data were processed in an open and appropriate manner to produce the graphic. There is nothing unusual about it. You and yours are simply using his choice of terms ("hide" and "trick") and NOTHING ELSE to accuse him of falsification. There was no decline that needed to be hidden. What he was doing and why he was doing it was and remain open knowledge with the entire field of dendrochronology. There were other conversations about this issue between Jones, Mann and others. The proof that he was talking about what he tells us he was talking about is definitive and such was the conclusion of all seven groups that reviewed this issue.

The only appropriate conclusion here is that you're a fucking idiot.
wow dude, you are truly a douche bag. Defending this is hilarious. Hide and trick, hmmmmm seems like scientific terms to me.
 
Given that a 3C rise would have a major negative effect on crop yields, it's not even a sensible question.

Given that a 3C rise would have a major negative effect on crop yields,

Do you base that on the higher yields during the MWP and the lower yields during the Little Ice Age?
 
I most certainly can. You forget how young we are. Homo Sapiens only became dominant some 200,000 years ago.

I most certainly can.

No you can't.

You forget how young we are. Homo Sapiens only became dominant some 200,000 years ago.


And that's proof changes in the past haven't been as fast or faster?

The Holocene proxy record contains nothing like the current warming. And there is more than enough resolution in the record to rule out an episode which would rise as ours has done and fall back to its original value all inside the best resolution of the record (making it invisible if you were really lucky) - besides, there is no sane mechanism which could produce such an episode. With our best efforts, our current warming will last centuries. Any such episode in the past would be driven by geological forces and would take place at a geologic pace.
 
So if a 3C increase actually increases crop yields, you still want to spend trillions in a futile attempt to stop it,
because change is bad?

If you think increased crop yields are worth the harm we will suffer from a rapid 3C temperature increase, you're out of your fucking mind.

Increased crop yields, fewer deaths in winter, less disease.

What harm will we suffer? Why will it increase 3C?

A sea level rise of well over a meter, hundreds of millions of refugees, the disappearance of the Arctic Ice cap, the Greenland ice cap, most glaciers and snowpack, crop failures worldwide...
 
Humanity has never experienced climate change at the rate at which it is currently taking place. The last time the oceans experienced pH changes as rapid as those they are currently undergoing, The Permian Triassic Extinction Event 252 million years ago, 96% of marine species went extinct. But you're not worried, are you.


And what proxy data are you using that has anything like the sort of resolution that would be required to make such statements? Let me guess...you are just talking out of your ass again.....as usual.
 
So if a 3C increase actually increases crop yields, you still want to spend trillions in a futile attempt to stop it,
because change is bad?

If you think increased crop yields are worth the harm we will suffer from a rapid 3C temperature increase, you're out of your fucking mind.

Increased crop yields, fewer deaths in winter, less disease.

What harm will we suffer? Why will it increase 3C?

A sea level rise of well over a meter, hundreds of millions of refugees, the disappearance of the Arctic Ice cap, the Greenland ice cap, most glaciers and snowpack, crop failures worldwide...

More fresh water, warmer temps...yeah not getting failing crops in this scenario
 
So if a 3C increase actually increases crop yields, you still want to spend trillions in a futile attempt to stop it,
because change is bad?

If you think increased crop yields are worth the harm we will suffer from a rapid 3C temperature increase, you're out of your fucking mind.

Increased crop yields, fewer deaths in winter, less disease.

What harm will we suffer? Why will it increase 3C?

A sea level rise of well over a meter, hundreds of millions of refugees, the disappearance of the Arctic Ice cap, the Greenland ice cap, most glaciers and snowpack, crop failures worldwide...

How much of that steaming pile of BS do you actually believe, and how much is just a pavlovian response to having your religion challenged?
 
Do you believe sea level is not rising So Stupid Decidedly Dumb?

If anyone around here is practicing a religion - a behavior where faith in the irrational replaces confidence in the scientific method - it would have to be deniers. No papers. No data. No working models. The conspiracy theory of all conspiracy theories. Less climate scientists than believe aliens walk among us. Yet you all hang on tight.

If course sea level is rising...at a rate slightly lower than the past 150 years. Certainly not at the inflated 3.3mm per year rate that is the result of invalid adjustment methods...

And of course you are practicing a religion...that's why you use the word denier to describe apostates and heretics...of all the words that could be used to describe skeptics...including skeptic...your church chose a word whose religious connotations go waaaaaaaayyyyy back. It is no accident crick and like always, you blindly follow along. Of course you are practicing a religion...you are operating on faith as evidenced by your inability to provide empirical evidence to support the most basic claim of the AGW hypothesis....that being that additional atmospheric CO2 causes temperatures to increase....every time you claim that you do but don't provide it, you are, as you have clearly stated...just talking out of your ass.
 
Then let's see your sea level data oh Grand PooBah of the Church of Irrational Denialism

PS: you people are the diametric opposite of skeptic. You claiming to be a skeptic is almost precisely as dishonest as Billy Boob claiming to have a degree in atmospheric physics.
 
Then let's see your sea level data oh Grand PooBah of the Church of Irrational Denialism

Already gave it to you...you didn't grasp it then, what makes you think you will grasp it this time? It is a bunch of graphs and you have proven REPEATEDLY that you can't look at graphs and glean any information at all from them...engineer my shiny metal ass.

Luckily, old data is still hanging around to be found to bring the fraud of the climate science modern climate science community into high relief. This is the sea level increase between 1880 and 1980 shown by NASA. The graph shows an increase of just over 3 inches of sea level increase between 1880 and 1980....NOTE the sharp decrease in the rate of increase after 1950.

ScreenHunter_2132-May.-31-12.25.jpg


You can't really scare people with a 3 inch sea level increase over a 100 year period so the frauds in climate science increased the figure to 6 inches per century with nothing more than adjustments.... NOTE the completely FAKE acceleration after 1950.

Trends_in_global_average_absolute_sea_level_1870-2008_US_EPA-1.png


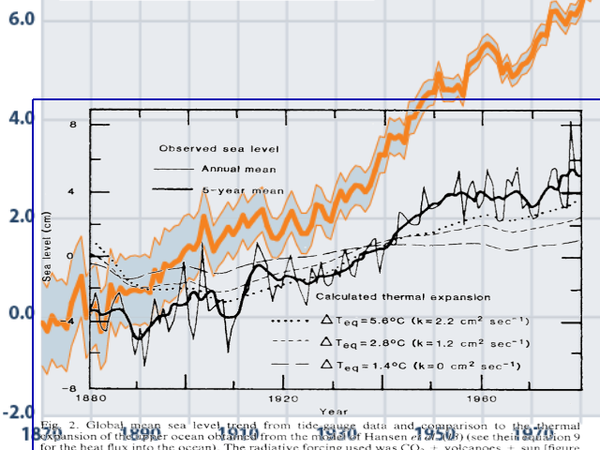
Here is an overlay of the two graphs on the same time scale. One is scientific in nature...showing actual observed sea level increases...the other is a piece of alarmist propaganda that has nothing whatsoever to do with science and everything to do with supporting a fraudulent narrative.

CGWXcXUU8AABZ5w.png


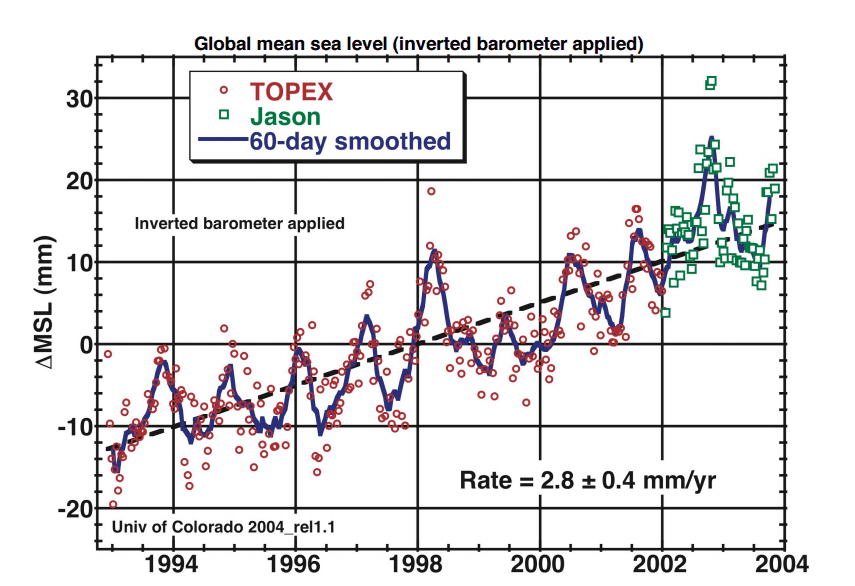
Then in 2004, the University of Colorado showed 2.8 mm per year rate of sea level increase.


ScreenHunter_10644-Oct.-03-11.07.gif


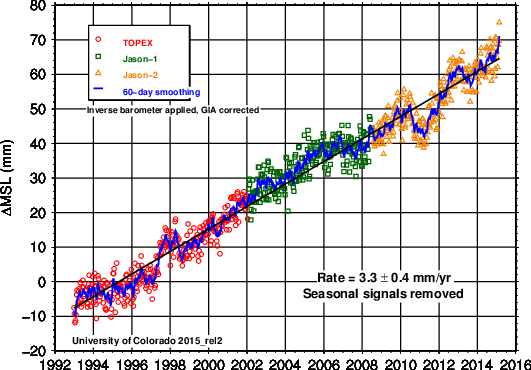
2.8 mm per year? Not very scary...even to alarmists so again, the data is heavily massaged using inappropriate, and completely fraudulent methods to achieve a 3.3mm per year rate of increase. A global isostatic adjustment was applied which is blatantly fraudulent in the context of sea level increase. Such adjustments are correct in the context of calculating ocean depth as the sea floor sinks and have absolutely no relationship to measuring sea level by satellites. Here is what the adjustments look like...Graph look familiar? You presented as "credible". What a laugh. Note the difference between the previously accepted TOPEX and JASON data between the first graph and the second...the second is the result of improper isostatic adjustment....

Sea level is increasing at a rate of less than 3mm per year....same as always...you and yours are liars crick....no way around it and everyone knows it...that's why study after study after study find that when both sides are presented, skeptics win every time and skeptics are winning the public debate hands down..

sl_ns_global-2.png


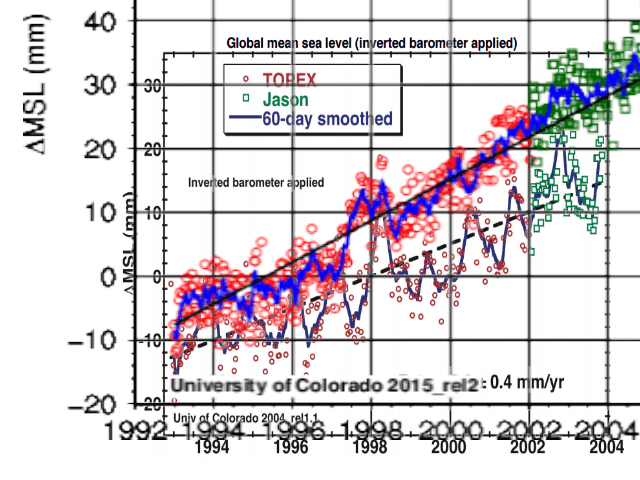
Here is an overlay of the two graphs at the same time scale.

AnimationImage86.png


Note the difference between the previously accepted TOPEX and JASON data between the first graph and the second...the second is the result of improper isostatic adjustment....

Sea level is increasing at a rate of less than 3mm per year....same as always...you and yours are liars crick....no way around it and everyone knows it...that's why study after study after study find that when both sides are presented, skeptics win every time and skeptics are winning the public debate hands down..
 
Do you believe sea level is not rising So Stupid Decidedly Dumb?

If anyone around here is practicing a religion - a behavior where faith in the irrational replaces confidence in the scientific method - it would have to be deniers. No papers. No data. No working models. The conspiracy theory of all conspiracy theories. Less climate scientists than believe aliens walk among us. Yet you all hang on tight.

Guam-from-air.jpg


Guam called, said it's still above water

The Marshall Islands called and said they're not.

Marshall Islands: Here Today, Gone Tomorrow?
 
Then let's see your sea level data oh Grand PooBah of the Church of Irrational Denialism

Already gave it to you...you didn't grasp it then, what makes you think you will grasp it this time? It is a bunch of graphs and you have proven REPEATEDLY that you can't look at graphs and glean any information at all from them...engineer my shiny metal ass.

Luckily, old data is still hanging around to be found to bring the fraud of the climate science modern climate science community into high relief. This is the sea level increase between 1880 and 1980 shown by NASA. The graph shows an increase of just over 3 inches of sea level increase between 1880 and 1980....NOTE the sharp decrease in the rate of increase after 1950.

ScreenHunter_2132-May.-31-12.25.jpg


You can't really scare people with a 3 inch sea level increase over a 100 year period so the frauds in climate science increased the figure to 6 inches per century with nothing more than adjustments.... NOTE the completely FAKE acceleration after 1950.

Trends_in_global_average_absolute_sea_level_1870-2008_US_EPA-1.png


Here is an overlay of the two graphs on the same time scale. One is scientific in nature...showing actual observed sea level increases...the other is a piece of alarmist propaganda that has nothing whatsoever to do with science and everything to do with supporting a fraudulent narrative.

CGWXcXUU8AABZ5w.png


Then in 2004, the University of Colorado showed 2.8 mm per year rate of sea level increase.


ScreenHunter_10644-Oct.-03-11.07.gif


2.8 mm per year? Not very scary...even to alarmists so again, the data is heavily massaged using inappropriate, and completely fraudulent methods to achieve a 3.3mm per year rate of increase. A global isostatic adjustment was applied which is blatantly fraudulent in the context of sea level increase. Such adjustments are correct in the context of calculating ocean depth as the sea floor sinks and have absolutely no relationship to measuring sea level by satellites. Here is what the adjustments look like...Graph look familiar? You presented as "credible". What a laugh. Note the difference between the previously accepted TOPEX and JASON data between the first graph and the second...the second is the result of improper isostatic adjustment....

Sea level is increasing at a rate of less than 3mm per year....same as always...you and yours are liars crick....no way around it and everyone knows it...that's why study after study after study find that when both sides are presented, skeptics win every time and skeptics are winning the public debate hands down..

sl_ns_global-2.png


Here is an overlay of the two graphs at the same time scale.

AnimationImage86.png


Note the difference between the previously accepted TOPEX and JASON data between the first graph and the second...the second is the result of improper isostatic adjustment....

Sea level is increasing at a rate of less than 3mm per year....same as always...you and yours are liars crick....no way around it and everyone knows it...that's why study after study after study find that when both sides are presented, skeptics win every time and skeptics are winning the public debate hands down..

Find us some scientists who agrees with this bullshit.
 
Do you believe sea level is not rising So Stupid Decidedly Dumb?

If anyone around here is practicing a religion - a behavior where faith in the irrational replaces confidence in the scientific method - it would have to be deniers. No papers. No data. No working models. The conspiracy theory of all conspiracy theories. Less climate scientists than believe aliens walk among us. Yet you all hang on tight.

Guam-from-air.jpg


Guam called, said it's still above water

The Marshall Islands called and said they're not.

Marshall Islands: Here Today, Gone Tomorrow?

They're in a different Pacific Ocean than Guam. How much must we lower CO2 to get the Marshall Islands back where they belong?

With 0 CO2 would the Marshall be 1,000 feet above sea level?

Marshall Islands? I guess we should spend $70 trillion to save them. Right?

Or......maybe it'd be cheaper to wipeout ISIS and send them to Syria?
I hear they have room.
And we could send the Muslim refugees to the Marshall Islands.
 
Then let's see your sea level data oh Grand PooBah of the Church of Irrational Denialism

Already gave it to you...you didn't grasp it then, what makes you think you will grasp it this time? It is a bunch of graphs and you have proven REPEATEDLY that you can't look at graphs and glean any information at all from them...engineer my shiny metal ass.

Luckily, old data is still hanging around to be found to bring the fraud of the climate science modern climate science community into high relief. This is the sea level increase between 1880 and 1980 shown by NASA. The graph shows an increase of just over 3 inches of sea level increase between 1880 and 1980....NOTE the sharp decrease in the rate of increase after 1950.

ScreenHunter_2132-May.-31-12.25.jpg


You can't really scare people with a 3 inch sea level increase over a 100 year period so the frauds in climate science increased the figure to 6 inches per century with nothing more than adjustments.... NOTE the completely FAKE acceleration after 1950.

Trends_in_global_average_absolute_sea_level_1870-2008_US_EPA-1.png


Here is an overlay of the two graphs on the same time scale. One is scientific in nature...showing actual observed sea level increases...the other is a piece of alarmist propaganda that has nothing whatsoever to do with science and everything to do with supporting a fraudulent narrative.

CGWXcXUU8AABZ5w.png


Then in 2004, the University of Colorado showed 2.8 mm per year rate of sea level increase.


ScreenHunter_10644-Oct.-03-11.07.gif


2.8 mm per year? Not very scary...even to alarmists so again, the data is heavily massaged using inappropriate, and completely fraudulent methods to achieve a 3.3mm per year rate of increase. A global isostatic adjustment was applied which is blatantly fraudulent in the context of sea level increase. Such adjustments are correct in the context of calculating ocean depth as the sea floor sinks and have absolutely no relationship to measuring sea level by satellites. Here is what the adjustments look like...Graph look familiar? You presented as "credible". What a laugh. Note the difference between the previously accepted TOPEX and JASON data between the first graph and the second...the second is the result of improper isostatic adjustment....

Sea level is increasing at a rate of less than 3mm per year....same as always...you and yours are liars crick....no way around it and everyone knows it...that's why study after study after study find that when both sides are presented, skeptics win every time and skeptics are winning the public debate hands down..

sl_ns_global-2.png


Here is an overlay of the two graphs at the same time scale.

AnimationImage86.png


Note the difference between the previously accepted TOPEX and JASON data between the first graph and the second...the second is the result of improper isostatic adjustment....

Sea level is increasing at a rate of less than 3mm per year....same as always...you and yours are liars crick....no way around it and everyone knows it...that's why study after study after study find that when both sides are presented, skeptics win every time and skeptics are winning the public debate hands down..

Find us some scientists who agrees with this bullshit.

It was produced by scientists...all of it....the alarmist adjustments are clearly visible. I don't expect you to see it because you have proven over and over that you can't read a graph...and even if you could see it, you wouldn't admit it...the entire sea level catastrophe lie is revealed in the first 3 graphs...observation vs adjustments...and you believe adjustments.
 

Forum List

Back
Top