I can NOT believe I am reading that! After all the screaming and hollering about manipulated data you gripe that he hasn't applied averaging and FILTERS? Fer chrissake!
No.. I'm bitching that someone is using intuition and guesswork rather than relying on what the tools of mathematics tell us...
Get a grip..

LOL. These guys scream about models, then when presented with data that is just bare facts, maxima and minima over the last 34 years, bitch because it was not presented in the fashion of a model.
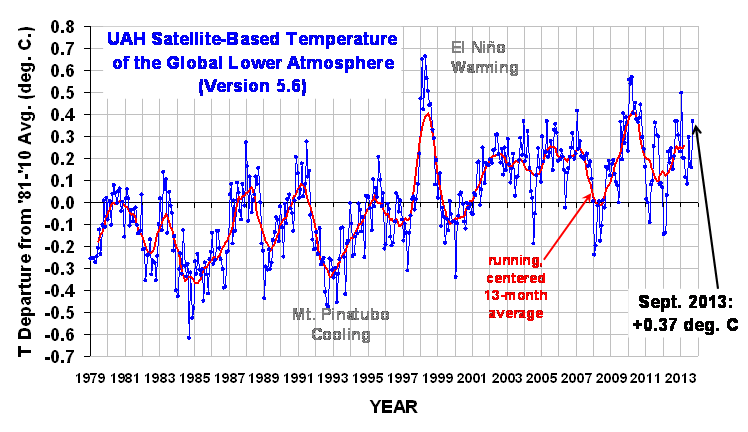
Those figures are the maxima and minima. Run a line on the maxima, it rises to the right. Run a line on the minima, it rises to the right. And Mathew and Dr. Spencer already presented you with an average and a running average. The fact that you are flapping yap when it is right there in your face by Dr. Spencer simply demonstrates that you are willing to tell bald faced lies with the contrary evidence sitting in front of you.
So you are saying that Mann and the IPCC are lying when they say there is no significant for the past 12, 15 or 17 years?
Show me an actual data prep that gives a number for a significant warming over the last 15 years. Quit your flap-yapping and put it up here...
 Go check out the forum rules and see if it's the alternative you prefer..