deanrd
Gold Member
- May 8, 2017
- 29,411
- 3,644
- 290
- Banned
- #121
Averages in 20 year increments don't really tell the story. It's all about extremes. Climate change is about extreme changes in the weather. Like having a 6 month drought and then 6 inches of rain. The average may look fine, but the burned out houses and the mudslides tell a different story.In reply your post 119, Mamooth:
You write,
"That's _still_ just a link to the front page of the website, and not to any actual data. So, you still haven't backed up anything that you've claimed. You can't figure out how to link properly. I know if I was going to crow about how great my links were, I'd proofread and check that the links actually went to what I was claiming. That level of common sense is clearly beyond you."
It is now 100% proven that you didn't read the LAWSUIT link at all since Willis was the one who made the chart BASED on the data from WRCC link, which I explained for you earlier, but you are too busy being an idiot to read and think decently when you wrote this crap at post 86:
"I addressed it directly, by posting the real data, along with the link to the source (NASA).
In stark contrast, you posted an unsourced propaganda piece. I went to the link on that chart, and it went nowhere, just to a broken page.
So, my stuff has a source. Yours doesn't. That makes your crap inferior and worthless, just propaganda for the rubes.
Seriously, did you really think you could fudge like that and not get called on it?"
The page was NEVER broken idiot!
Your "stuff" ended in year 1999, COMPLETELY irrelevant to the 2018 Fire!
You are truly stupid man!
Here is what YOU never read since it was in the LAWSUIT LINK I posted at post 8:
So … did scientists actually “predict” that past temperatures have gone up by one degree? Can scientists actually predict the past? And can we really expect half a degree of warming in the next decade? To get some perspective on these questions, I thought I’d take a look at the records. I found an interesting site, the Western Regional Climate Center (WRCC), which has a variety of weather-related data state by state. So with no further ado, here is the average temperature in California from January of 1895 to the present, October 2018.

Figure 1. Average monthly California temperatures from the WRCC. The seasonal variations have been removed.
Now, has the temperature gone up by one degree as the Governor said? Well, yes, but only since 1895. Since 1895, it has been going up at a rate of about 0.12°C, twelve-hundredths of a degree Celsius, per decade. [NOTE: An earlier version of this post mistakenly stated that the trend was two-hundredths of a degree per decade, rather than the correct value of twelve-hundredths of a degree per decade. The text has been changed to reflect the correct values. My thanks to Grietver, the commenter who pointed out my error.]
Skipping down to here,
Well, if it’s not the temperature, how about the rainfall? Is climate change making the state dryer? Fortunately, the WRCC has the data for that as well. Here’s the monthly rainfall in California.
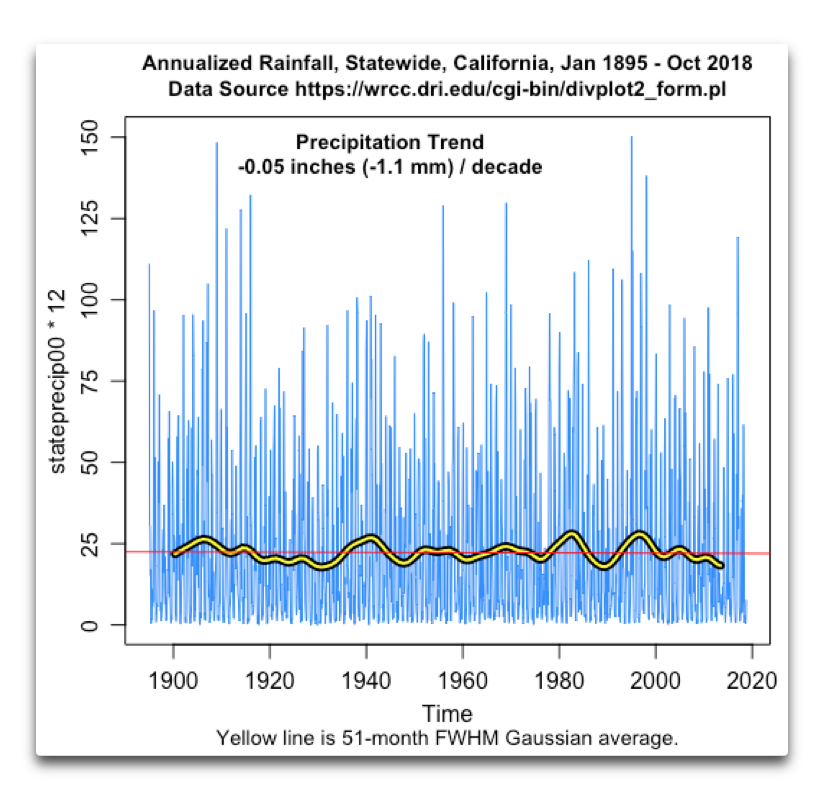
Figure 2. Annualized monthly rainfall in California per the WRCC. Since rainfall data is usually given in inches per year, not per month, I have multiplied all of the values by 12 to “annualize” them, in order to make the trend a yearly trend.


