JimBowie1958
Old Fogey
- Sep 25, 2011
- 63,590
- 16,776
- 2,220
I have often wondered what the states would look like compared to each other if you adjusted for the Purchase Power of the USD in that state and then adjusted for taxes in that state. So I finally got off my dead ass and started working on putting these stats together into a chart and a couple of maps.
First Column is a short form of the states name
Second column is the average income for that state unadjusted
Third column is the PPP for $100 in that state, i.e. how many dollars you have to spend to buy something that on average costs $100 around the rest of the country.
Fourth column is the adjusted income based on the PPP for that state. This is calculated by dividing the average income by the PPP and multiplying by 100.
Fifth Column is the average tax including state income tax, sales tax and property taxes.
Sixth column is the final adjusted income for that state taking into account the PPP and state taxes
Seventh Column is an index I got by using the formula (100-tax)/PPP * 100
State …….Average Inc PPP Adj Income Av Tax Adj Final Inc TaxPPP Index
Alabama "$44,765.00" 86.80 "$51,572.58" 10.2 "$46,312.18" 103.4562212
Alaska …."$73,355.00" 105.60 "$69,464.96" 13.4 "$60,156.66" 82.00757576
Arizona .."$51,492.00" 96.20 "$53,525.99" 16.2 "$44,854.78" 87.11018711
Arkansas "$41,995.00" 87.40 "$48,049.20" 24.8 "$36,133.00" 86.04118993
California "$64,500.00" 113.40 "$56,878.31" 20 "$45,502.65" 70.54673721
Colorado "$63,909.00" 103.20 "$61,927.33" 19.3 "$49,975.35" 78.19767442
Connect. "$71,346.00" 108.70 "$65,635.69" 20.5 "$52,180.38" 73.13707452
Delaware "$61,255.00" 100.40 "$61,010.96" 33.6 "$40,511.27" 66.13545817
Dist Col. "$75,628.00" 117.00 "$64,639.32" 17.5 "$53,327.44" 70.51282051
Florida .."$49,426.00" 99.50 "$49,674.37" 17.6 "$40,931.68" 82.81407035
Georgia "$51,244.00" 92.60 "$55,339.09" 19.2 "$44,713.99" 87.25701944
Hawaii .."$73,486.00" 118.80 "$61,856.90" 18 "$50,722.66" 69.02356902
Idaho …."$48,275.00" 93.40 "$51,686.30" 16.7 "$43,054.68" 89.1862955
Illinois ..."$59,588.00" 99.70 "$59,767.30" 23.3 "$45,841.52" 76.93079238
Indiana "$50,532.00" 90.70 "$55,713.34" 20.8 "$44,124.97" 87.32083793
Iowa ….. "$54,736.00" 90.30 "$60,615.73" 20.5 "$48,189.50" 88.03986711
Kansas "$53,906.00" 90.40 "$59,630.53" 19.2 "$48,181.47" 89.38053097
Kentuc.. "$45,215.00" 88.60 "$51,032.73" 21.2 "$40,213.79" 88.93905192
Louisia. "$45,727.00" 90.60 "$50,471.30" 22.3 "$39,216.20" 85.7615894
Maine .."$51,494.00" 98.00 "$52,544.90" 18.1 "$43,034.27" 83.57142857
Maryla. "$75,847.00" 109.60 "$69,203.47" 22.8 "$53,425.08" 70.4379562
Mass... "$70,628.00" 106.90 "$66,069.22" 25.1 "$49,485.85" 70.06548176
Mich.... "$51,084.00" 93.50 "$54,635.29" 19.8 "$43,817.51" 85.77540107
Minne.. "$63,488.00" 97.40 "$65,182.75" 32.9 "$43,737.63" 68.89117043
Missi... "$40,593.00" 86.20 "$47,091.65" 14.2 "$40,404.63" 99.53596288
Misso.. "$50,238.00" 89.30 "$56,257.56" 22.5 "$43,599.61" 86.78611422
Mont.. "$49,509.00" 94.80 "$52,224.68" 14.7 "$44,547.66" 89.97890295
Nebr... ."$54,996.00" 90.60 "$60,701.99" 22.5 "$47,044.04" 85.54083885
Neva... "$52,431.00" 98.00 "$53,501.02" 15.2 "$45,368.87" 86.53061224
NHam .."$70,303.00" 105.00 "$66,955.24" 16.3 "$56,041.53" 79.71428571
NJers .."$72,222.00" 113.40 "$63,687.83" 24.3 "$48,211.69" 66.75485009
N Mex .."$45,382.00" 94.40 "$48,074.15" 14.7 "$41,007.25" 90.36016949
NYork ..."$60,850.00" 115.30 "$52,775.37" 25.3 "$39,423.20" 64.78751084
N Car …."$47,830.00" 91.20 "$52,445.18" 19.6 "$42,165.92" 88.15789474
N Dak ..."$60,557.00" 92.30 "$65,608.88" 21.5 "$51,502.97" 85.04875406
Ohio ….."$51,075.00" 89.20 "$57,258.97" 26.9 "$41,856.31" 81.95067265
Oklah….."$48,568.00" 89.90 "$54,024.47" 15 "$45,920.80" 94.54949944
Oreg …."$54,148.00" 99.20 "$54,584.68" 19.2 "$44,104.42" 81.4516129
Penn …."$55,702.00" 97.90 "$56,896.83" 21.5 "$44,664.01" 80.18386108
Rh Isl …."$58,073.00" 98.70 "$58,837.89" 25 "$44,128.42" 75.98784195
S Car ..."$47,238.00" 90.30 "$52,312.29" 15.4 "$44,256.20" 93.68770764
S Dak ..."$53,017.00" 88.20 "$60,109.98" 16 "$50,492.38" 95.23809524
Tenne ..."$47,275.00" 89.90 "$52,586.21" 21 "$41,543.10" 87.87541713
Texas .."$55,653.00" 96.80 "$57,492.77" 18.5 "$46,856.61" 84.19421488
Utah.. .."$62,912.00" 97.00 "$64,857.73" 17.8 "$53,313.06" 84.74226804
Verm ..."$56,990.00" 101.60 "$56,092.52" 18.7 "$45,603.22" 80.01968504
Virgi …..."$66,262.00" 102.50 "$64,645.85" 18.1 "$52,944.95" 79.90243902
Wash...."$64,129.00" 104.80 "$61,191.79" 20.8 "$48,463.90" 75.57251908
WVirg ..."$42,019.00" 88.90 "$47,265.47" 14.5 "$40,411.97" 96.17547807
Wisc ….."$55,638.00" 93.10 "$59,761.55" 20.6 "$47,450.67" 85.28464017
wyo.. ..."$60,214.00" 96.20 "$62,592.52" 14.2 "$53,704.38" 89.18918919
This Map Shows the Average Income in Every State—and What It's Really Worth
What's the average annual income after taxes in every state?


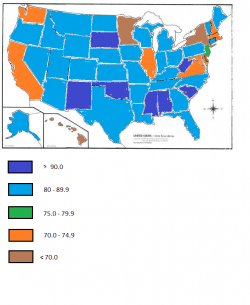
The last map shows the best states to live in if you have a fixed income derived from Social Security, pensions, etc. The higher the PPPTax Index the better for your life style
First Column is a short form of the states name
Second column is the average income for that state unadjusted
Third column is the PPP for $100 in that state, i.e. how many dollars you have to spend to buy something that on average costs $100 around the rest of the country.
Fourth column is the adjusted income based on the PPP for that state. This is calculated by dividing the average income by the PPP and multiplying by 100.
Fifth Column is the average tax including state income tax, sales tax and property taxes.
Sixth column is the final adjusted income for that state taking into account the PPP and state taxes
Seventh Column is an index I got by using the formula (100-tax)/PPP * 100
State …….Average Inc PPP Adj Income Av Tax Adj Final Inc TaxPPP Index
Alabama "$44,765.00" 86.80 "$51,572.58" 10.2 "$46,312.18" 103.4562212
Alaska …."$73,355.00" 105.60 "$69,464.96" 13.4 "$60,156.66" 82.00757576
Arizona .."$51,492.00" 96.20 "$53,525.99" 16.2 "$44,854.78" 87.11018711
Arkansas "$41,995.00" 87.40 "$48,049.20" 24.8 "$36,133.00" 86.04118993
California "$64,500.00" 113.40 "$56,878.31" 20 "$45,502.65" 70.54673721
Colorado "$63,909.00" 103.20 "$61,927.33" 19.3 "$49,975.35" 78.19767442
Connect. "$71,346.00" 108.70 "$65,635.69" 20.5 "$52,180.38" 73.13707452
Delaware "$61,255.00" 100.40 "$61,010.96" 33.6 "$40,511.27" 66.13545817
Dist Col. "$75,628.00" 117.00 "$64,639.32" 17.5 "$53,327.44" 70.51282051
Florida .."$49,426.00" 99.50 "$49,674.37" 17.6 "$40,931.68" 82.81407035
Georgia "$51,244.00" 92.60 "$55,339.09" 19.2 "$44,713.99" 87.25701944
Hawaii .."$73,486.00" 118.80 "$61,856.90" 18 "$50,722.66" 69.02356902
Idaho …."$48,275.00" 93.40 "$51,686.30" 16.7 "$43,054.68" 89.1862955
Illinois ..."$59,588.00" 99.70 "$59,767.30" 23.3 "$45,841.52" 76.93079238
Indiana "$50,532.00" 90.70 "$55,713.34" 20.8 "$44,124.97" 87.32083793
Iowa ….. "$54,736.00" 90.30 "$60,615.73" 20.5 "$48,189.50" 88.03986711
Kansas "$53,906.00" 90.40 "$59,630.53" 19.2 "$48,181.47" 89.38053097
Kentuc.. "$45,215.00" 88.60 "$51,032.73" 21.2 "$40,213.79" 88.93905192
Louisia. "$45,727.00" 90.60 "$50,471.30" 22.3 "$39,216.20" 85.7615894
Maine .."$51,494.00" 98.00 "$52,544.90" 18.1 "$43,034.27" 83.57142857
Maryla. "$75,847.00" 109.60 "$69,203.47" 22.8 "$53,425.08" 70.4379562
Mass... "$70,628.00" 106.90 "$66,069.22" 25.1 "$49,485.85" 70.06548176
Mich.... "$51,084.00" 93.50 "$54,635.29" 19.8 "$43,817.51" 85.77540107
Minne.. "$63,488.00" 97.40 "$65,182.75" 32.9 "$43,737.63" 68.89117043
Missi... "$40,593.00" 86.20 "$47,091.65" 14.2 "$40,404.63" 99.53596288
Misso.. "$50,238.00" 89.30 "$56,257.56" 22.5 "$43,599.61" 86.78611422
Mont.. "$49,509.00" 94.80 "$52,224.68" 14.7 "$44,547.66" 89.97890295
Nebr... ."$54,996.00" 90.60 "$60,701.99" 22.5 "$47,044.04" 85.54083885
Neva... "$52,431.00" 98.00 "$53,501.02" 15.2 "$45,368.87" 86.53061224
NHam .."$70,303.00" 105.00 "$66,955.24" 16.3 "$56,041.53" 79.71428571
NJers .."$72,222.00" 113.40 "$63,687.83" 24.3 "$48,211.69" 66.75485009
N Mex .."$45,382.00" 94.40 "$48,074.15" 14.7 "$41,007.25" 90.36016949
NYork ..."$60,850.00" 115.30 "$52,775.37" 25.3 "$39,423.20" 64.78751084
N Car …."$47,830.00" 91.20 "$52,445.18" 19.6 "$42,165.92" 88.15789474
N Dak ..."$60,557.00" 92.30 "$65,608.88" 21.5 "$51,502.97" 85.04875406
Ohio ….."$51,075.00" 89.20 "$57,258.97" 26.9 "$41,856.31" 81.95067265
Oklah….."$48,568.00" 89.90 "$54,024.47" 15 "$45,920.80" 94.54949944
Oreg …."$54,148.00" 99.20 "$54,584.68" 19.2 "$44,104.42" 81.4516129
Penn …."$55,702.00" 97.90 "$56,896.83" 21.5 "$44,664.01" 80.18386108
Rh Isl …."$58,073.00" 98.70 "$58,837.89" 25 "$44,128.42" 75.98784195
S Car ..."$47,238.00" 90.30 "$52,312.29" 15.4 "$44,256.20" 93.68770764
S Dak ..."$53,017.00" 88.20 "$60,109.98" 16 "$50,492.38" 95.23809524
Tenne ..."$47,275.00" 89.90 "$52,586.21" 21 "$41,543.10" 87.87541713
Texas .."$55,653.00" 96.80 "$57,492.77" 18.5 "$46,856.61" 84.19421488
Utah.. .."$62,912.00" 97.00 "$64,857.73" 17.8 "$53,313.06" 84.74226804
Verm ..."$56,990.00" 101.60 "$56,092.52" 18.7 "$45,603.22" 80.01968504
Virgi …..."$66,262.00" 102.50 "$64,645.85" 18.1 "$52,944.95" 79.90243902
Wash...."$64,129.00" 104.80 "$61,191.79" 20.8 "$48,463.90" 75.57251908
WVirg ..."$42,019.00" 88.90 "$47,265.47" 14.5 "$40,411.97" 96.17547807
Wisc ….."$55,638.00" 93.10 "$59,761.55" 20.6 "$47,450.67" 85.28464017
wyo.. ..."$60,214.00" 96.20 "$62,592.52" 14.2 "$53,704.38" 89.18918919
This Map Shows the Average Income in Every State—and What It's Really Worth
What's the average annual income after taxes in every state?
The last map shows the best states to live in if you have a fixed income derived from Social Security, pensions, etc. The higher the PPPTax Index the better for your life style