
ScienceRocks
Democrat all the way!
- Banned
- #1
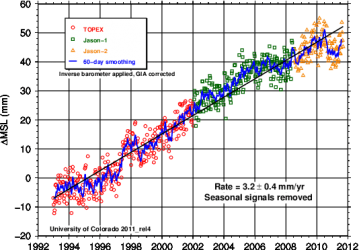
Sea levels are now rising once again with the latest data point above the "means" finally. So it was only a short term down turn! Lets see if we see a period of faster sea level rises now.
CU Sea Level Research Group | University of Colorado
It appears that we're now at the second or third highest data point on the jason 1 or 2 graph!
CU Sea Level Research Group | University of Colorado
It appears that we're now at the second or third highest data point on the jason 1 or 2 graph!
Attachments
Last edited:

