Record hot years near impossible without manmade climate change – study

Frank, that post by itself is worthless. You know it, I know it, and that is why I :) at you.

Jake's a DENIER, denying that 62>58. Jake's AGWCult snorts the koolaid from the can and believes that 58F in 2015 is warmer than the 62F in 1997.
Frank, no serious person is going to argue confirmation science with you. Personally attacking me does not help you. Do you have peer reviewed objective studies that address your concern. You don't? Then your argument is oveer.
 
Jake's a DENIER, denying that 62>58. Jake's AGWCult snorts the koolaid from the can and believes that 58F in 2015 is warmer than the 62F in 1997.

Frank denies 62.3 > 62, which is what the numbers would be if you used matching baselines.

That is, he's deliberately engaging in open fraud by knowingly comparing measurements from different baselines.

Frank also cries every year on Stalin's birthday, as it reminds him that Stalin is dead, so now Frank can only service Stalin's ideals instead of personally servicing Stalin the man.
 
Jake's a DENIER, denying that 62>58. Jake's AGWCult snorts the koolaid from the can and believes that 58F in 2015 is warmer than the 62F in 1997.

Frank denies 62.3 > 62, which is what the numbers would be if you used matching baselines.

That is, he's deliberately engaging in open fraud by knowingly comparing measurements from different baselines.

Frank also cries every year on Stalin's birthday, as it reminds him that Stalin is dead, so now Frank can only service Stalin's ideals instead of personally servicing Stalin the man.

Please explain the concept of "baseline" because it sounds like you're hiding the decline

Screen%20Shot%202016-01-21%20at%203.19.31%20PM.png
 
Frank, you got your silly argument's ass handed to you, and now you want to baseline double down your ignorance. Do you understand what Mamooth said?
 
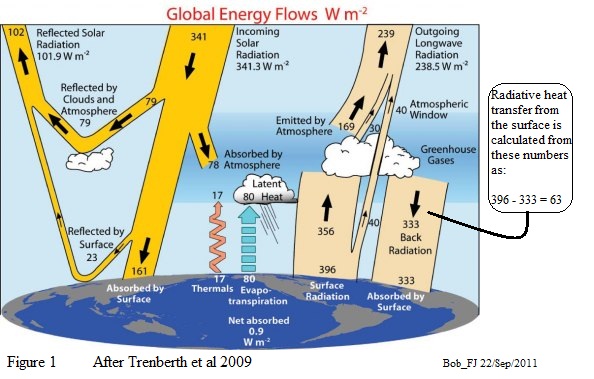
yes, but the 400W out is counterbalanced by 335 back radiation at the surface. of the 65W difference, 40W escapes directly to space and only 25W makes it to the cloud boundary. evaporation and convection carry 100W up to the cloud boundary. 100W is more than 65W, and quite a bit more than 25W. I think we can safely say that evaporation and convection are the primary energy transport at the surface, not radiation.
I agree, but I think it is essential to show the 335 back radiation in a diagram otherwise those who look at the S-B equation will see 400 W output and wonder why the earth doesn't freeze.
 
I look at the right side as 24 hour GreenHouse exchange. And the direct Solar stuff on the left is a 6 to 8 hour a day effective forcing. The 17 thermals and 80 transvap is more effective during the day but doesn't shut down at night. Now the idiot Trenberth calls these numbers "ENERGY" but they are not energy without the temporal considerations.

So my confusion is (and Trenberth's problem) is the 161 for HALF a day doesn't even cover the outgoing sum of convection, conduction, and radiation ENERGY.. Shouldn't we be popsicles by now if these are the numbers??
I'm not sure why you think Trenberth calls it energy. He consistently defines the numbers as Watts per square meter. Is there an accompanying text that uses the term energy? Watts does have a temporal aspect. Energy can be measured in Joules. Watts is measured in Joules per second, a unit of power.

As far as turning into Popsicles, IanC covered it. If you look at the up and down arrows in the diagram, they all balance out. The one major down arrow is back radiation that some here (you know who you are) deny.
 
Frank, you got your silly argument's ass handed to you, and now you want to baseline double down your ignorance. Do you understand what Mamooth said?

Can you explain why and how temperature reading must be subjected to a "baseline"?

What's the temperature outside Jake, both before and after the baseline
 
stalin.jpg


Top picture before baseline adjustment. Bottom picture is 1997 temperature with baseline adjustment
 
Jake's a DENIER, denying that 62>58. Jake's AGWCult snorts the koolaid from the can and believes that 58F in 2015 is warmer than the 62F in 1997.

Frank denies 62.3 > 62, which is what the numbers would be if you used matching baselines.

That is, he's deliberately engaging in open fraud by knowingly comparing measurements from different baselines.

Frank also cries every year on Stalin's birthday, as it reminds him that Stalin is dead, so now Frank can only service Stalin's ideals instead of personally servicing Stalin the man.

What's the temperature in your city today, I mean prior to the baseline adjustment
 
Frank, you got your silly argument's ass handed to you, and now you want to baseline double down your ignorance. Do you understand what Mamooth said?


No,fakey. It is YOU who had your butt handed to you.
 
Seems like the thing we need to find out is whether the radiation exchange at the skin is as static as you make it out to be -- or whether there are "non-linearities" in what can get convected. The skin is also absorbing direct solar radiation. And at those times -- I'm almost certain that convection is equal to or larger than the radiation budget.
I largely agree, except that I think convection would rarely be larger than the radiation budget.

The ocean radiates about 400 W no matter what happens. Even if the temperature is continually changing chaotically the ocean is still about roughly 300 deg K, and the outgoing radiation is a function of temperature in deg K.

Different organizations have different estimates for convection and evaporation heat loss from the earth surface: convection 17 to 24 W, and evaporation 78 to 85 W. That is a total of 95 to 109 W. That is still a small part of the energy output compared to the 400 W radiation loss. However that 95 to 109 W loss is even more chaotic than temperature variations since convection and evaporation are enhanced by wind. Evaporation is also a function of relative humidity. Maybe at times convection exceeds 400 W but I wouldn't say that it is common.

That is straying from my original point. I would say that absorption and emission of thermal radiation practically everywhere else on earth is only skin deep so it's not that much different than the ocean in principle at the surface. The major difference is that ocean has mechanisms for carrying heat efficiently to depths that land does not have. In short, the people here that are concerned about IR back-radiation absorption in the top microns are not talking about something very meaningful. The ocean is heated by short wave radiation.


yes, but the 400W out is counterbalanced by 335 back radiation at the surface. of the 65W difference, 40W escapes directly to space and only 25W makes it to the cloud boundary. evaporation and convection carry 100W up to the cloud boundary. 100W is more than 65W, and quite a bit more than 25W. I think we can safely say that evaporation and convection are the primary energy transport at the surface, not radiation.

That's the general case in MOST thermo problems. And why they can largely IGNORE radiative transfer in College curriculums until the advanced level. When estimating MOST material/air boundary problems --- the conductive/convective equations will get you REAL CLOSE to the answer.

Lord it bugs me to drag this out.. But I got a question.

trenberth-cartoon-ex-colose.jpg


I look at the right side as 24 hour GreenHouse exchange. And the direct Solar stuff on the left is a 6 to 8 hour a day effective forcing. The 17 thermals and 80 transvap is more effective during the day but doesn't shut down at night. Now the idiot Trenberth calls these numbers "ENERGY" but they are not energy without the temporal considerations.

So my confusion is (and Trenberth's problem) is the 161 for HALF a day doesn't even cover the outgoing sum of convection, conduction, and radiation ENERGY.. Shouldn't we be popsicles by now if these are the numbers??


I'm not sure that I am following you. the 161 solar is obviously an average for 24 hrs and the full range of latitude. isnt solar max about 1300-1400W directly overhead?

on the other hand, without the 336 back radiation we would get pretty cold, pretty fast. while I realize that a large portion of the atmospheric heatsink is made up of the kinetic energy/ potential energy dance of air molecules, without GHGs to capture surface radiation the atmosphere would obviously be cooler, produce less back radiation, and hence cool the surface.

occasionally I talk about GW in real time, face to face. one of the first things I try to get someone to do is imagine what would happen without sunlight, how the atmosphere would give up its energy and freeze into a thin layer on the surface. and then add the solar back. how long would it take to fluff up the atmosphere, how much spacebound radiation would there be at the beginning, how much at equilibrium, how much energy stored?

so many people here focus on one facet of one problem and ignore all the basic stuff.

That's why I need a chat about this. The TOTAL solar isolation at TOA is about 1380. And about 25% of that reaches the ground. I DONT BELIEVE that number is 24 hour averaged (like an ENERGY should be) because those numbers are W/sqm.. So if it's NOT time averaged --- we'd be an iceball with the RATES of 24 hour IR radiation, and the convection/conduction going skyward "MOST" of the day..
 
The temperature in NY right now is 30F but that's before the -4F baseline adjustment so it's really 26F
 
That's why I need a chat about this. The TOTAL solar isolation at TOA is about 1380. And about 25% of that reaches the ground. I DONT BELIEVE that number is 24 hour averaged (like an ENERGY should be) because those numbers are W/sqm.. So if it's NOT time averaged --- we'd be an iceball with the RATES of 24 hour IR radiation, and the convection/conduction going skyward "MOST" of the day..
According to Trenberth the watts/sq m hitting the equator at high noon is about 1364. Since one side is in the dark that number is divided by 2.

Application of Lambert's law is used to account for the lower power outside the equatorial noon. That leads to another factor of 2.

So the total reduction in the equatorial noon power is a factor of 4 to provide a daily average sunlight. 1364/4 = 341. That's where Trenberth gets his incoming solar radiation at the top center of his diagram.

In short the left side of Trenberth's diagram is already a daily time averaged W/sq m.

I hope this is not talking down to you, but your question is not too clear.

According to him the surface radiation minus the back radiation is 63 W. When you add that to the 17 W thermals and 80 W evaporation you get,
Power radiated from earth = 63+17+80 = 160 W.

If you compare that with the sun SW radiation from the sun, 161 W, you are missing 1 W in the power balance. That Watt is shown at the very bottom (0.9 W/sq m). Of course you can't subtract all those back of the envelope numbers and get anything meaningful. That 1 W is thrown in because that's what he considers leads to the global warming since 1890.
What warming since 1890????
 
I look at the right side as 24 hour GreenHouse exchange. And the direct Solar stuff on the left is a 6 to 8 hour a day effective forcing. The 17 thermals and 80 transvap is more effective during the day but doesn't shut down at night. Now the idiot Trenberth calls these numbers "ENERGY" but they are not energy without the temporal considerations.

So my confusion is (and Trenberth's problem) is the 161 for HALF a day doesn't even cover the outgoing sum of convection, conduction, and radiation ENERGY.. Shouldn't we be popsicles by now if these are the numbers??
I'm not sure why you think Trenberth calls it energy. He consistently defines the numbers as Watts per square meter. Is there an accompanying text that uses the term energy? Watts does have a temporal aspect. Energy can be measured in Joules. Watts is measured in Joules per second, a unit of power.

As far as turning into Popsicles, IanC covered it. If you look at the up and down arrows in the diagram, they all balance out. The one major down arrow is back radiation that some here (you know who you are) deny.

Look at the TITLE of the Trenberth graphic.. Look at how the google searches bring up the chart. Or just look at his work.. An Error Occurred Setting Your User Cookie
I always imagined he came back from giving this paper and got pummeled by a bunch of physicists and engineers for using the wrong units.

As far as the units go.. A joule is.

The work required to produce one watt of power for one second, or one "watt second" (W·s) (compare kilowatt hour- 3.6 megajoules)

Applying 1W for 1sec is a measure of energy.. watt-seconds -- so a JOULE per second = watt is measure of POWER -- not energy. Get it? watt-second/second?

And the numbers in the Trenberth diagram DO NOT balance out in terms of Power applied TIMES the relative time they applied to any position on the planet during a day/night cycle.

If you were to apply a "duty cycle" to those forcing over a diurnal period to account for their relative ENERGY contributions -- those flows are FAR from "adding up".. I need to study this. The original Trenberth papers are no help. Because climate scientists seem to only care about "forcings" and not energy flows..
 
Last edited:
That's why I need a chat about this. The TOTAL solar isolation at TOA is about 1380. And about 25% of that reaches the ground. I DONT BELIEVE that number is 24 hour averaged (like an ENERGY should be) because those numbers are W/sqm.. So if it's NOT time averaged --- we'd be an iceball with the RATES of 24 hour IR radiation, and the convection/conduction going skyward "MOST" of the day..
According to Trenberth the watts/sq m hitting the equator at high noon is about 1364. Since one side is in the dark that number is divided by 2.

Application of Lambert's law is used to account for the lower power outside the equatorial noon. That leads to another factor of 2.

So the total reduction in the equatorial noon power is a factor of 4 to provide a daily average sunlight. 1364/4 = 341. That's where Trenberth gets his incoming solar radiation at the top center of his diagram.

In short the left side of Trenberth's diagram is already a daily time averaged W/sq m.

I hope this is not talking down to you, but your question is not too clear.

According to him the surface radiation minus the back radiation is 63 W. When you add that to the 17 W thermals and 80 W evaporation you get,
Power radiated from earth = 63+17+80 = 160 W.

If you compare that with the sun SW radiation from the sun, 161 W, you are missing 1 W in the power balance. That Watt is shown at the very bottom (0.9 W/sq m). Of course you can't subtract all those back of the envelope numbers and get anything meaningful. That 1 W is thrown in because that's what he considers leads to the global warming since 1890.

OK --- that might help. Let's take seasonal declination out of the picture by stating that for any point on a longtitude line there is another point that is at the opposite "lambert angle".. And call that winter and summer.

Now you're left with lambert projections for 0 to PI during a daily cycle. So the average lambert factor on that cosine projection is 2/PI .. (don't want to derive that in plain text !!! Not a factor of 2.. That's the average of the TOTAL power projected on any particular lattitude line DURING the DAY. Dividing that by a factor of 2 for day/night gives you an "energy factor" closer to a third than a quarter.

So if 1360 is the power at TOA in the solar column -- that projection WITH TIME CONSIDERED would be more like 433 watts/sqm equivalent. If that math is correct. And the simplifications are valid -- maybe we should be COOKED by now and not be popsicles. :dunno:

I chuckled at your comment about Trenberth finding EXACTLY 0.9watts/sqm out off of the "envelope calculation".. I'm tending to agree that was quite "convenient" given the estimates. :wink: Dontchathink?
 
Maybe I deserved to pummeled for bringing this up. Rather than quietly figuring it out. But for such an important diagram for the cause of Global Warning consensus -- there sure are a lot of issues with it. And I'm not ashamed to make mistakes thinking in real time with no safety net or scripted talking points.. :2up:.
 
Maybe I deserved to pummeled for bringing this up. Rather than quietly figuring it out. But for such an important diagram for the cause of Global Warning consensus -- there sure are a lot of issues with it. And I'm not ashamed to make mistakes thinking in real time with no safety net or scripted talking points.. :2up:.

Ian -- just like you to clarify what you're "agreeing" with here. That I should be pummeled? Or that Trenberth had a few issues in that "paper" ?? :lmao:
 
Maybe I deserved to pummeled for bringing this up. Rather than quietly figuring it out. But for such an important diagram for the cause of Global Warning consensus -- there sure are a lot of issues with it. And I'm not ashamed to make mistakes thinking in real time with no safety net or scripted talking points.. :2up:.


hahahahaha, I am still not sure if I am getting your point but it seems vaguely familiar to one of my longstanding concerns.

no solar input at all for half the day (yes I know that length of daylight varies, especially at extreme latitudes), then an increase to maximum followed by a decrease to minimum (sawtooth or sine? or combination?). this type of uneven input does not lend itself to meaningful averages.

my concern comes from the concept of threshold values. many reactions or events depend on a threshold. fires may be self sustaining once they start but they need an initial minimum temp. thunderstorms (heat pipes) produce their own 'power' but still need the right initial conditions. I believe the globe would be a totally different place if we actually lived in a twilight of constant 1/4 solar input rather than darkness punctuated with maximums.

back radiation is constant, diffuse and weak, with no ability to do work. all it is is a placeholder in the equation to generate a surface temperature. it is not an addition to solar input as the climate models consider it. high energy, collimated solar energy is the driving force behind everything, back radiation nada.
 

Forum List

Back
Top