New Year’s Resolutions For Climate Scientists

uahvsrss2000-500x341.jpg


uahvsrss_2000-500x341.jpg


there are the trends for UAH and RSS since 2000 or 2001, depending on how you want to define decade trend. both are much less that the 0.14C/decade trend that you stated which covers the whole time period since satellites started measuring temps in 1979

The Blackboard » UAH vs RSS Trends since 2001 or 2000
 
september2010arcticsmoothing2.gif


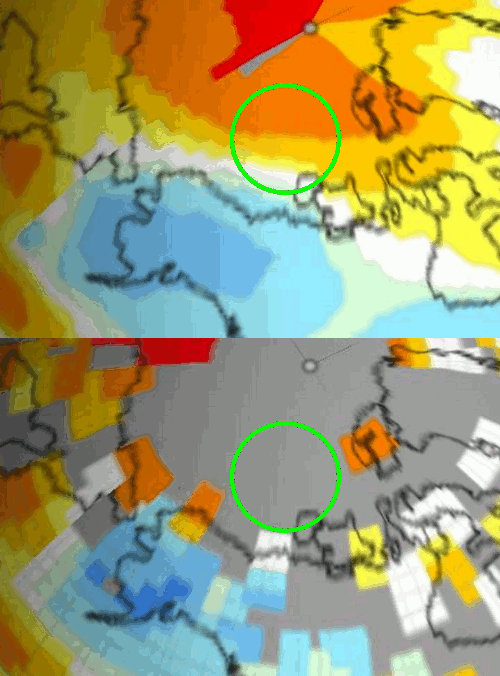
arctic temps (from spotty data) vs arctic temps with infills where there is no data.
 
uahvsrss2000-500x341.jpg


uahvsrss_2000-500x341.jpg


there are the trends for UAH and RSS since 2000 or 2001, depending on how you want to define decade trend. both are much less that the 0.14C/decade trend that you stated which covers the whole time period since satellites started measuring temps in 1979

The Blackboard » UAH vs RSS Trends since 2001 or 2000
The "blackboard" is not the UAH, you are really desperate.

The direct link to the UAH site seems to be down, but here is the UAH data mirrored on the denier site JunkScience.

JunkScience.com's "Global Warming" at a glance

[FONT=arial, verdana, helvetica]UAH Global Temperature Report for the current month (The University of Alabama in Huntsville

[/FONT][FONT=arial, verdana, helvetica]Temperature Variation From Average:
Lower Troposphere:
Global:
[FONT=arial, verdana, helvetica]November 2011: +0.12 °C[/FONT]

Northern Hemisphere: +0.08 °C
Southern Hemisphere: +0.17 °C
[/FONT]
[FONT=arial, verdana, helvetica]Peak recorded anomaly:
February, 1998: +0.66 °C
Current relative to peak recorded: -0.54 °C
[/FONT]
[FONT=arial, verdana, helvetica]DECADAL TREND:
Global:
+0.14 °C
Northern Hemisphere: +0.20 °C
Southern Hemisphere: +0.08 °C
[/FONT]
[FONT=arial, verdana, helvetica]Last update: December 17, 2011[/FONT]
 
Last edited:
september2010arcticsmoothing2.gif


arctic temps (from spotty data) vs arctic temps with infills where there is no data.
No links to either satellite data or Hansen, what a surprise, NOT! Just made up crap from the denier site Real [fake] Science.
 
TAKE NOTE: From Update 13 Sep 2010 *************************

As an alert, we will be generating anomalies when the December data have been processed to be based on the 30-year mean annual cycle of 1981-2010 to match the 30-year normal time frame of many meteorology anomalies. This will replace the older reference annual cycle of 20-years (1979-1998).

the 0.14C/decade trend is for the whole period from 1979, not the last decade.
 
september2010arcticsmoothing2.gif


arctic temps (from spotty data) vs arctic temps with infills where there is no data.
No links to either satellite data or Hansen, what a surprise, NOT! Just made up crap from the denier site Real [fake] Science.

you are just denying the obvious. there is no data in the gray areas until the grid cell size is expanded and infilled from other areas. as usual we are being asked to ignore small warming (in some cases cooling) from the best and most completely covered areas in the world, and then accept the rapid warming from poorly measured areas (often with no data within hundreds or thousands of kilometres).
 
uahvsrss2000-500x341.jpg


uahvsrss_2000-500x341.jpg


there are the trends for UAH and RSS since 2000 or 2001, depending on how you want to define decade trend. both are much less that the 0.14C/decade trend that you stated which covers the whole time period since satellites started measuring temps in 1979

The Blackboard » UAH vs RSS Trends since 2001 or 2000
The "blackboard" is not the UAH, you are really desperate.

The direct link to the UAH site seems to be down, but here is the UAH data mirrored on the denier site JunkScience.

JunkScience.com's "Global Warming" at a glance

[FONT=arial, verdana, helvetica]UAH Global Temperature Report for the current month (The University of Alabama in Huntsville

[/FONT][FONT=arial, verdana, helvetica]Temperature Variation From Average:
Lower Troposphere:
Global:
[FONT=arial, verdana, helvetica]November 2011: +0.12 °C[/FONT]

Northern Hemisphere: +0.08 °C
Southern Hemisphere: +0.17 °C
[/FONT]
[FONT=arial, verdana, helvetica]Peak recorded anomaly:
February, 1998: +0.66 °C
Current relative to peak recorded: -0.54 °C
[/FONT]
[FONT=arial, verdana, helvetica]DECADAL TREND:
Global:
+0.14 °C
Northern Hemisphere: +0.20 °C
Southern Hemisphere: +0.08 °C
[/FONT]
[FONT=arial, verdana, helvetica]Last update: December 17, 2011[/FONT]

TAKE NOTE: From Update 13 Sep 2010 *************************

As an alert, we will be generating anomalies when the December data have been processed to be based on the 30-year mean annual cycle of 1981-2010 to match the 30-year normal time frame of many meteorology anomalies. This will replace the older reference annual cycle of 20-years (1979-1998).
the 0.14C/decade trend is for the whole period from 1979, not the last decade.
BULLSHIT!!!

Whenever CON$ are caught with their foot in their mouth, they play dumb. All that says is that the anomalies will be measured against a 30 year average rather than a 20 year average, not that a decade is 30 years. sheeesh! :rofl::lmao:

BTW, Christy and Spencer always choose whatever gives the lowest global warming numbers. They could have used a 30 year average before this, so obviously the 1979-2008 30 year cycle gives a warmer trend than the 1981-2010 they chose.
 
Please identify the satellite that came from. You won't because it isn't satellite data. The fact remains, satellite data, which is not vulnerable to UHI effects or placement of sensors near heat sources, shows warming for the last decade and have not been fudged by Hansen.
Admit the truth for once in your life, you will feel better.
 
Edthecynic is a left wing partisan hack, and Ian, you have pretty much pwned him. However, he will never EVER turn away from the Church of Al Gore no matter what. You are wasting your time.

yah, I know. I'm just killing time. but thanks for the advice
 
Please identify the satellite that came from. You won't because it isn't satellite data. The fact remains, satellite data, which is not vulnerable to UHI effects or placement of sensors near heat sources, shows warming for the last decade and have not been fudged by Hansen.
Admit the truth for once in your life, you will feel better.

why are you talking about satellites? Hansen doesnt use satellites, he uses surface based readings that are massively transformed by unaccountable 'adjustments'. GISS uses infills and averaging over various sized grid cells to emphisize warming in poorly measured areas while de-emphisizing well measured areas that dont show much (or any) warming.
 
actually I think the point of the OP is to ask climate scientists to stop manipulating data to distort and exaggerate conclusions into preordained statements of catastrophic AGW.
Then why did you ask honest people to lie about it cooling for "at least the last decade?"

Even data from deniers Christy and Spencer, who actually got caught manipulating the data to distort and exaggerate a conclusion of global cooling while it was actually warming, shows the globe has warmed [FONT=arial, verdana, helvetica]+0.14 °C this last decade.[/FONT]

even the BEST data, which havent gone through peer review yet to see if the way they cut up data adds a spurious warming, shows that 1/3 of the locations show cooling. the global average temp uses a lot of areas like the arctic which has madeup and infilled data that say what the people running the data sets want them to say. the whole thing depends on the weightings of different areas, and the adjustments made to the raw data.
how is it dishonest when the satellites dont give numbers for areas they dont cover but it is OK with you when Hansen makes up numbers for those same areas?
Please identify the satellite that came from. You won't because it isn't satellite data. The fact remains, satellite data, which is not vulnerable to UHI effects or placement of sensors near heat sources, shows warming for the last decade and have not been fudged by Hansen.
Admit the truth for once in your life, you will feel better.

why are you talking about satellites? Hansen doesnt use satellites, he uses surface based readings that are massively transformed by unaccountable 'adjustments'. GISS uses infills and averaging over various sized grid cells to emphisize warming in poorly measured areas while de-emphisizing well measured areas that dont show much (or any) warming.
Again the dumb act!

I specifically chose the UAH satellite data from Christy and Spencer to expose your lie that it's been cooling for at least the last decade because I knew it takes away all your deflections. No UHI effect, no sensors near heat sources, and no infills. You still made the infill claim and accused Hansen of doing it rather than admit your lie, but now you admit Hansen has nothing to do with the satellite data that still shows global warming for at least the last decade with no infill data.

Now come on, admit you want honest scientists to resolve to parrot denier lies. Your soul will thank you if you just admit the truth at least once in your pathetic life. You should have quit with your fellow travelers patting you on your back rather than to keep making a fool of yourself.
 
Last edited:
This says it all! Here is an excerpt from Hansens latest plea for help. This sort of verbiage only exists in the minds of the mentally challenged.i


"The precision achieved by the most advanced generation of radiation budget satellites is indicated by the planetary energy imbalance measured by the ongoing CERES (Clouds and the Earth’s Radiant Energy System) instrument (Loeb et al., 2009), which finds a measured 5-year-mean imbalance of 6.5 W/m2 (Loeb et al., 2009). Because this result is implausible, instrumentation calibration factors were introduced to reduce the imbalance to the imbalance suggested by climate models, 0.85 W/m2 (Loeb et al., 2009)."


http://pubs.giss.nasa.gov/docs/notyet/submitted_Hansen_etal.pdf
They altered data to fit the model.

Real scientists alter the model to fit the data.
 
As you well know, the satellite data does not cover the poles, so you are just spewing pure bullshit when you discredit the fact that the satellite data, even from deniers, shows warming for the last decade that you what honest people to lie about and "admit that temperatures have been cooling for at least the last decade."

I've posted the proof over a dozen times when you've asked for it, but each time you've cut and run from the thread only to post the above highlighted lie in a new thread.

The main problem with your argument is that the satellite data does not show warming over the last decade. At best it shows temperatures have been flat. In reality it shows a slight degree of cooling.
 
The direct link to the UAH site seems to be down, but here is the UAH data mirrored on the denier site JunkScience.

JunkScience.com's "Global Warming" at a glance

[FONT=arial, verdana, helvetica]UAH Global Temperature Report for the current month (The University of Alabama in Huntsville

[/FONT][FONT=arial, verdana, helvetica]Temperature Variation From Average:
Lower Troposphere:
Global:
[FONT=arial, verdana, helvetica]November 2011: +0.12 °C[/FONT]

Northern Hemisphere: +0.08 °C
Southern Hemisphere: +0.17 °C
[/FONT]
[FONT=arial, verdana, helvetica]Peak recorded anomaly:
February, 1998: +0.66 °C
Current relative to peak recorded: -0.54 °C
[/FONT]
[FONT=arial, verdana, helvetica]DECADAL TREND:
Global:
+0.14 °C
Northern Hemisphere: +0.20 °C
Southern Hemisphere: +0.08 °C
[/FONT]
[FONT=arial, verdana, helvetica]Last update: December 17, 2011[/FONT]

As you well know, the satellite data does not cover the poles, so you are just spewing pure bullshit when you discredit the fact that the satellite data, even from deniers, shows warming for the last decade that you what honest people to lie about and "admit that temperatures have been cooling for at least the last decade."

The main problem with your argument is that the satellite data does not show warming over the last decade. At best it shows temperatures have been flat. In reality it shows a slight degree of cooling.
It doesn't matter who the CON$ervative is, once they sink their teeth into a lie, they never let go no matter how much evidence there is to the contrary.
Thank You.
 
As you well know, the satellite data does not cover the poles, so you are just spewing pure bullshit when you discredit the fact that the satellite data, even from deniers, shows warming for the last decade that you what honest people to lie about and "admit that temperatures have been cooling for at least the last decade."

I've posted the proof over a dozen times when you've asked for it, but each time you've cut and run from the thread only to post the above highlighted lie in a new thread.

The main problem with your argument is that the satellite data does not show warming over the last decade. At best it shows temperatures have been flat. In reality it shows a slight degree of cooling.

The main problem with your post is you never show the slightest backing for your lies. Pattycake, ever consider doing anything but parroting lying talking points?
 
actually I think the point of the OP is to ask climate scientists to stop manipulating data to distort and exaggerate conclusions into preordained statements of catastrophic AGW.
Then why did you ask honest people to lie about it cooling for "at least the last decade?"

Even data from deniers Christy and Spencer, who actually got caught manipulating the data to distort and exaggerate a conclusion of global cooling while it was actually warming, shows the globe has warmed [FONT=arial, verdana, helvetica]+0.14 °C this last decade.[/FONT]

even the BEST data, which havent gone through peer review yet to see if the way they cut up data adds a spurious warming, shows that 1/3 of the locations show cooling. the global average temp uses a lot of areas like the arctic which has madeup and infilled data that say what the people running the data sets want them to say. the whole thing depends on the weightings of different areas, and the adjustments made to the raw data.

you keep saying Christie and Spencer were caught manipulating data yet you never show any proof. their data set and methods are much more open and responsive to criticisms than most of the others yet you seem to have a hard on against them while holding credulous high esteem for other data sets that hide their data and methodologies so that it is difficult to find and correct mistakes.

LOL Ian, old boy, you were doing handflips when Dr. Muller announced he was going to do a total inventory of the data. Stating how this was going to show how Hansen and the rest had manipulated the data. Then Muller came out and stated that the data was done in a professional manner and was spot on. Now you have added Dr. Muller to the villian list. You guys are a hoot.

The last two years have seen massive crop damage from weather events worldwide. In the US, there was more damage to buildings, infrastructure, and crops in 2011 than in the whole of the decade of the '80s.

2010 saw a few tens of meters plumes of methane from
Arctic Ocean clathrates going directly into the atmosphere. 2011 saw thousands of plumes, some a kilometer or more across going directly into the atmosphere.

The more evidence of a climate change in progress that we see, the more people like you deny what is in front of your face. You are starting to look very silly.
 

Forum List

Back
Top