Mayday!! USS AGWCult struck amidship listing badly to port!!

CrusaderFrank

Diamond Member
May 20, 2009
144,469
66,860
2,330
potd-mammoth_3550009k.jpg


45,000 years ago humans were butchering mammoths in -- the Arctic!

No! Can't be!

Those Geico cavemen must have used internal combustion engines!!!

GISS shows the temperature 45,000 years ago at 13.32257863F D'oh!

Methane from mammoth farts must have melted the ice caps -- right????
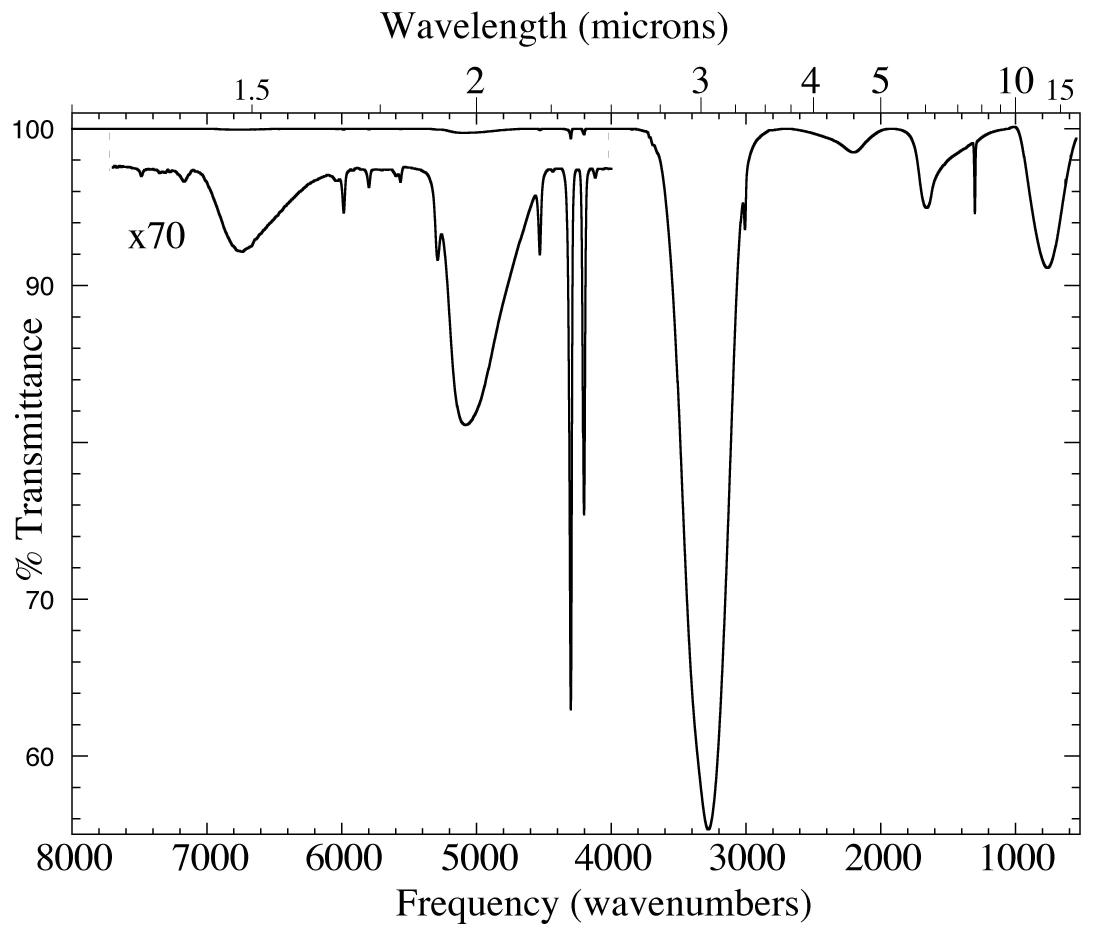
CH4fig1.jpg


Yeah, I knew it. Here's ^ the lab work showing how methane raised the temperature 68F
 
Frank, can you explain the point of all that babbling? People who don't speak your cult lingo aren't able to understand it.

That is, summarize your argument, step by step, in detail, in actual English.

Now, if you were just posting drunk again, simply say that, and we'll understand.
 
I forgot the AGWCult only gets their news from approved AGW sites.

"A mummified mammoth found in the Siberian Arctic has injuries consistent with human hunting – even though the mammoth died 10,000 years before humans were thought to have reached the Arctic. A study on the hunted carcass, published Thursday in Science, pushes human occupation of the Arctic back to at least 45,000 years ago."

Ancient mammoth hunt discovery puts humans in the Arctic much earlier than we’d thought

First the scientist figure out clouds cover Greenland this week and now this.

WOW we continue to learn new things every day!
 
Wow...

The Arctic was warmer than today and supported huge mammals which gieco man hunted and ate... We have found geico man and mamoth's frozen in the ice so it must have frozen over quickly and unexpectedly..

SO.... Ice ages and warming are not new things? And all this time I thought AGW was something new, or is it just deception about something very old that happens naturally?

polarbearparty.gif
 
One More shot through the bow of the boat... More running in circles by the alarmists and fools..

Wilson 2016

It got odder when I analyzed the authorship of the temperature records reconstructed from the 53 proxies. In 48 of the proxy, the original lead author is also an author on this paper. It is true that they said this study is the result of a consortium of dendroclimatologists. However, I had expected them to look at more tree ring temperature reconstructions from other authors. So when they say they depend on the expert judgement of the authors of the proxies, in more than 90% of the proxies studied, they are merely saying they trust their own judgment.
And indeed, they think quite highly of their own judgement. rating it “expert”.

Another made up proxy reconstruct with over 40% of the data manufactured and of course, its the most accurate set of all time... Willis shows how they use circular logic and circular methods to create their conclusions.. (running in circles with sharp objects...).

One more lame attempt to "legitimize" Mann and his failed Hockey Stick proxy crap.. The recipe is always the same; make up data, torture it, and post the same result you wanted in the first place. Ignore anything which shows your premise false and incorrect.. They are consistent...

Source
 
Now this reply is one that tears a hole amid-ship.. Damn the Torpedo....

I can see how you can use tree rings to correlate major climatic events, such as the slowdown in growth caused by a major eruption, like a Krakatoa magnitude eruption.
However, to try and define temperatures from tree rings on an annual basis is just plain voodoo, because of:

1. Rainfall variations.
2. Shade variations from other trees.
3. Fertilisation from nearby forest fires.
4. Fertilisation from the occasional animal dump.
5. Nitrate boost from lightning storms.
6. Variations in growth depending on the side of trunk.
7. Occasional insect infestations on leaves.
8. Variations in competition from roots of nearby trees for water and nutrients.
9. Variation in ring widths depending on the age of the trees.
10. Variation in soil temperatures depending on slope direction.

I have seen much more comprehensive lists, but the bottom line is this: the only place you can magically transform BS readings into ‘hard facts’ is in climate science, where the use of voodoo statistical techniques is considered both acceptable and normal.

"I dont know how much more she can take Captain" (in my best Mr Scott voice)

Trying like hell to defend CAGW, The hockey Stick and Michale Mann (and his law suit, which he is loosing badly...)

Source
 
And here is the cream of the crop... This torpedo sinks not only this reconstruction but the whole Hokey Stick graph in one shot. And it is verifiable / repeatable science too boot.

Michael Mann’s infamous ‘hockey stick chart’, even if badly constructed, is a CO2 concentration plot more than it is a temperature chart, particularly in the modern era. If the effect of CO2 fertilization is subtracted from the ring widths, the ‘temperature blade’ is truncated. Similarly if the upturn in this study’s ‘temperature chart’ at the end is first corrected for CO2 fertilization (using available records) there is a ‘temperature’ deduction throughout the modern age.

Whether wonky statistical techniques are used or not, a tree ring width has to be corrected for CO2 availability before the temperature signal can be extracted. Once the CO2 hockey stick growth is subtracted from the tree ring width hockey stick, the remaining basically flat line proves that tree rings provide a poor record of temperature.

Account for the increased CO2 and plant reaction to it.. MANN DIDN'T! when it is corrected for there is no spike current day, essentially a flat line..

'Mann' the life boats.......

Source
 
I can see how you can use tree rings to correlate major climatic events, such as the slowdown in growth caused by a major eruption, like a Krakatoa magnitude eruption.
However, to try and define temperatures from tree rings on an annual basis is just plain voodoo, because of:

1. Rainfall variations.
2. Shade variations from other trees.
3. Fertilisation from nearby forest fires.
4. Fertilisation from the occasional animal dump.
5. Nitrate boost from lightning storms.
6. Variations in growth depending on the side of trunk.
7. Occasional insect infestations on leaves.
8. Variations in competition from roots of nearby trees for water and nutrients.
9. Variation in ring widths depending on the age of the trees.
10. Variation in soil temperatures depending on slope direction.

So, based on the expertise you garnered obtaining that mail order meteorology certificate, you've decided the entire field of dendrochronology is without merit. Man, will those PhDs be disappointed when they hear about it.

HAHAHAHAHAaahahaahaaaaa....
 
There has been a whole series of ice ages. And during this time, there were also interglacials. During this time, there were all kinds of large mammals in North America, and other continents. They survived those periods, yet because of the Younger Dryas, they died out.

Quaternary extinction event - Wikipedia, the free encyclopedia

The Late Pleistocene extinction event saw the extinction of many mammals weighing more than 40 kg.
The extinctions in the Americas entailed the elimination of all the larger (over 100 kg) mammalian species of South American origin, including those that had migrated north in theGreat American Interchange. Only in North America, South America, and Australia, did the extinction occur at family taxonomic levels or higher.
There was a very rapid cooling at the beginning of the period, and a very rapid warming at the end. And extinctions at both times. We have yet to establish what caused the either the rapid cooling or the rapid warming. And why whatever happened tipped the change so rapidly.
So, here we are, creating a situation that we have no idea as to what the results will be, with idiots stating that nothing can happen.
 

Forum List

Back
Top