
ScienceRocks
Democrat all the way!
- Banned
- #1
Insane Solar Power Growth (Graph)
June 30th, 2014 by Zachary Shahan
Insane Solar Power Growth (Graph) ?
June 30th, 2014 by Zachary Shahan
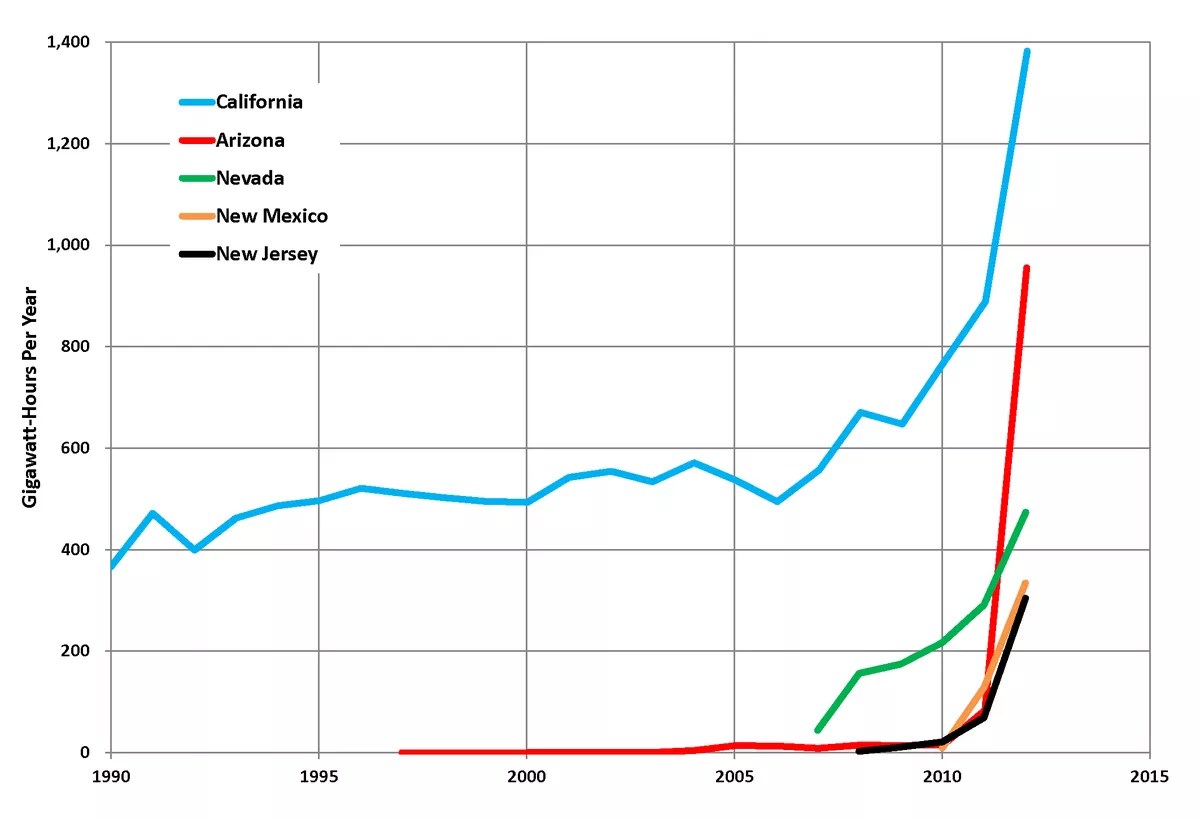
The following is a fun graph I recently ran across on Wikipedia. It shows the completely explosive solar power growth that has occurred in California, Arizona, New Jersey, Nevada, and New Mexico since 2010. Different factors have been at play here. For one, the price of solar panels has come down dramatically. In some of these markets, 3rd-party solar that lets people go solar for $0 down or close to $0 down has been important. In California, it accounts for about 7080% of the residential solar market. The SREC market in New Jersey has been big for stimulating growth there. No matter how you look at it, though, this is awesome:
Insane Solar Power Growth (Graph) ?