Old Rocks
Diamond Member
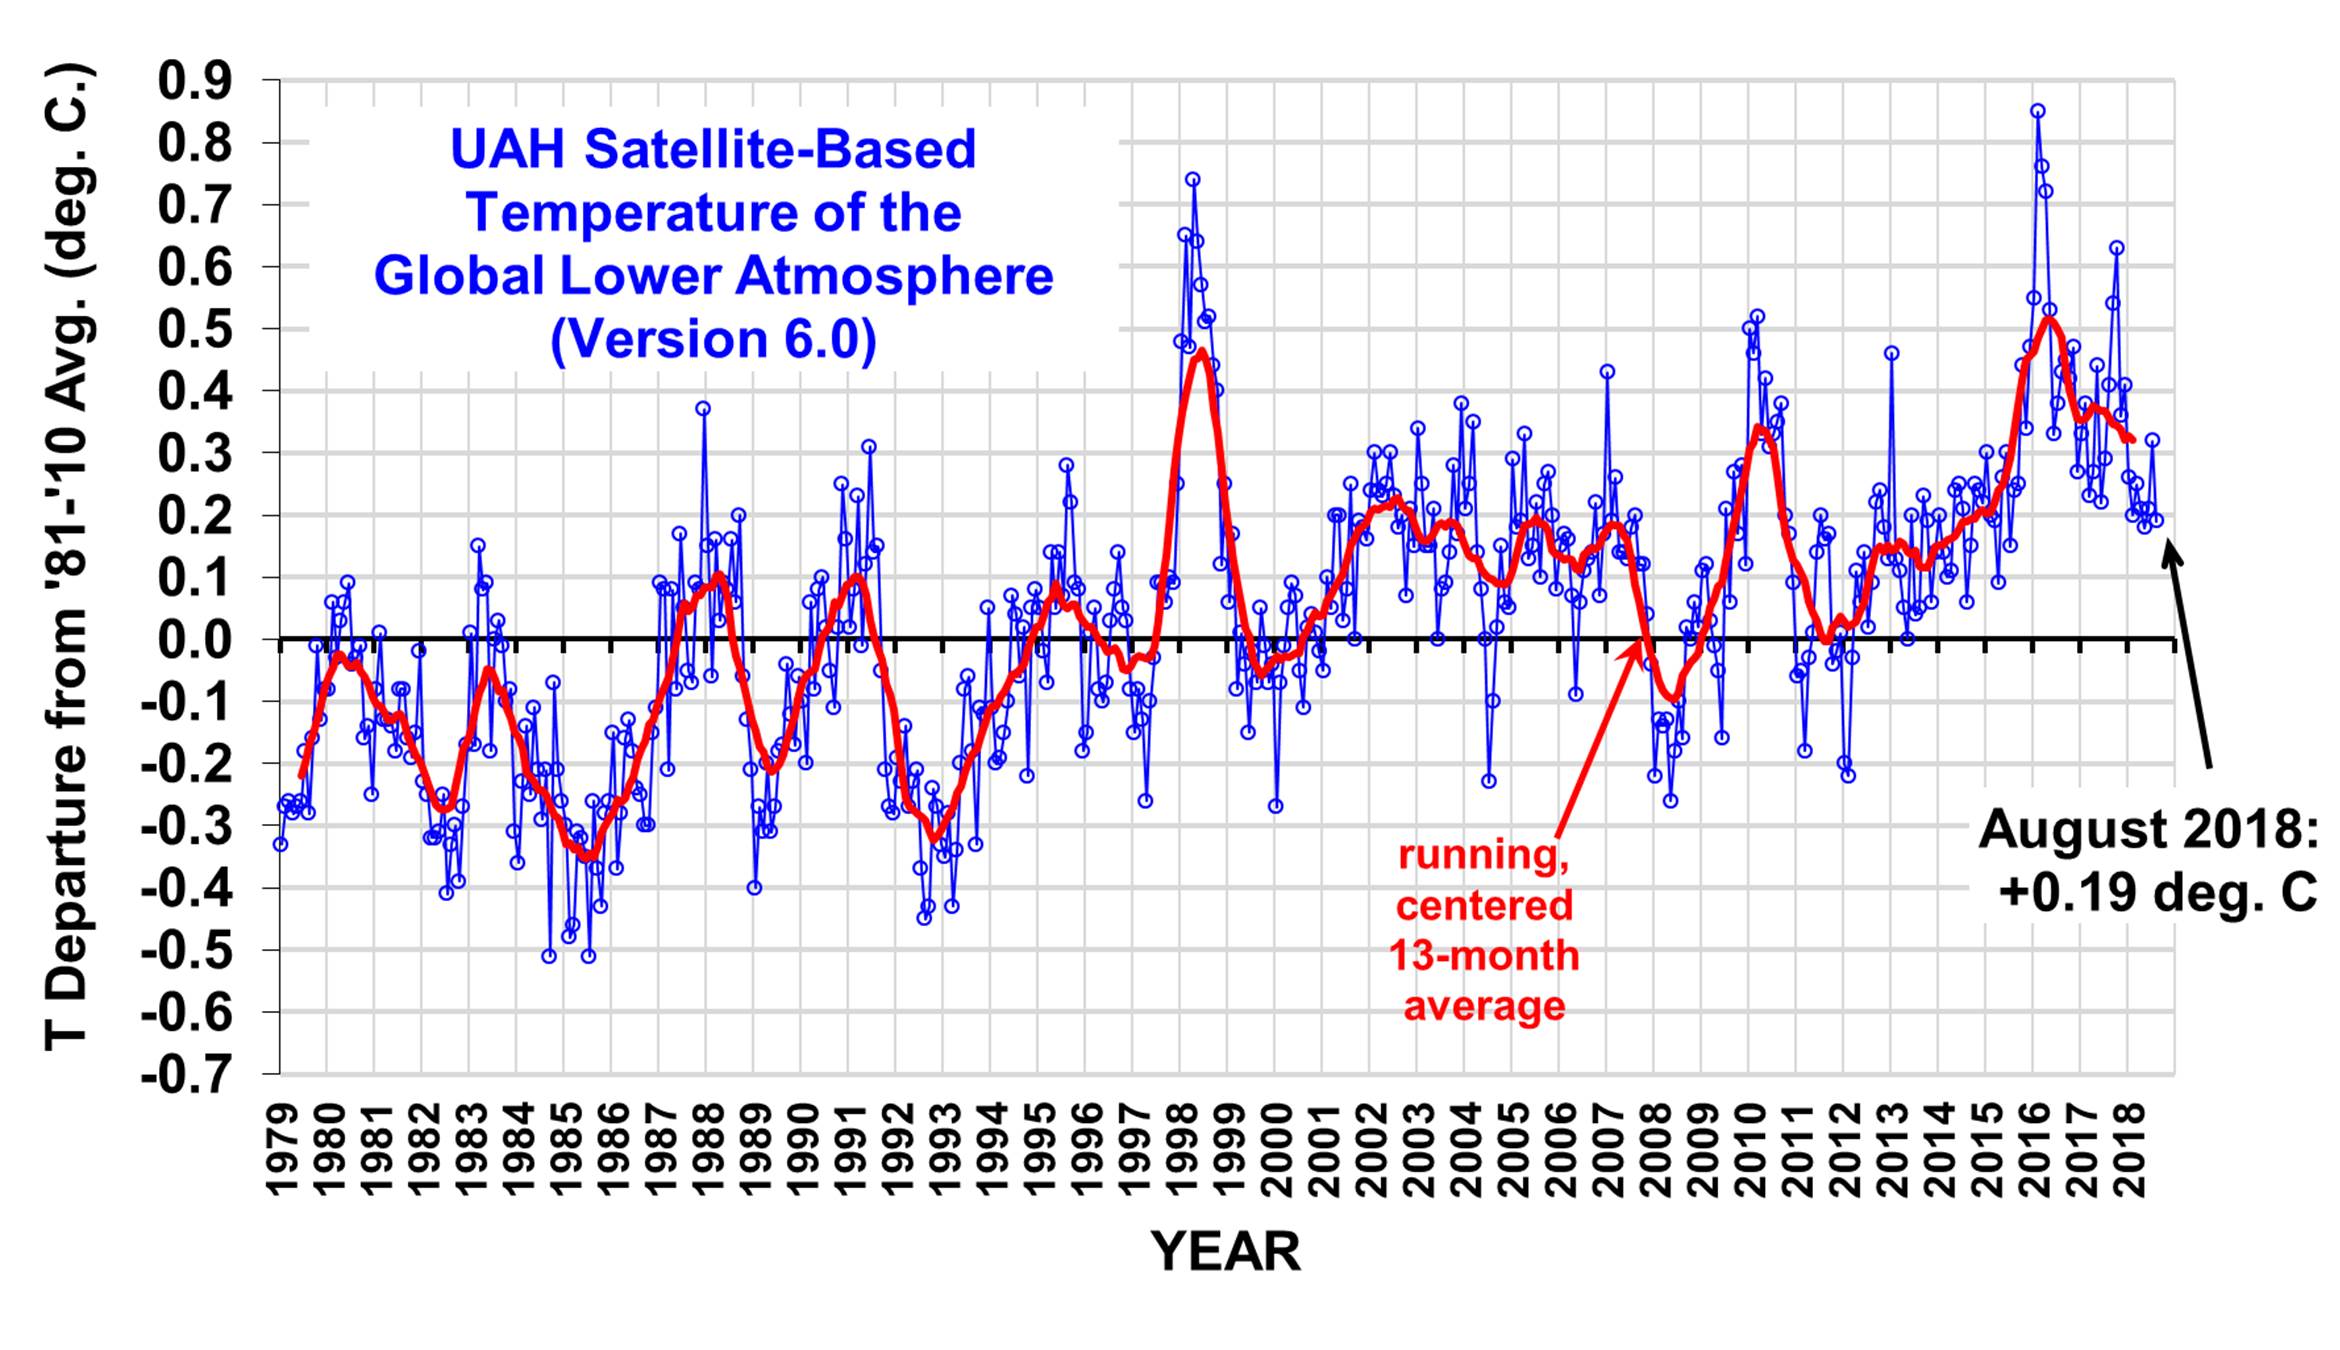
Hurricanes and Tropical Storms - Annual 2017 | State of the Climate | National Centers for Environmental Information (NCEI)
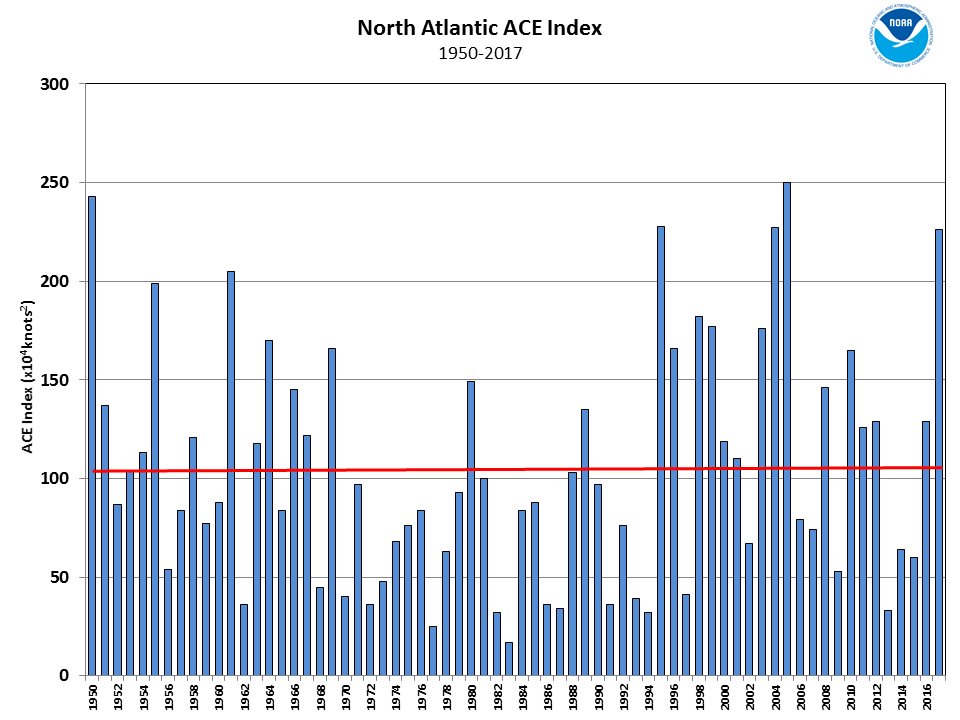
1950 through 1994, two years above 200, three years above 150, eight years above 100. 1994 to 2017, four years above 200, one of which hit 250, five years above 150, six years above 100. Storms of My Grandchildren have arrived early.