Rikurzhen
Gold Member
- Jul 24, 2014
- 6,145
- 1,292
- 185
Firearm rights have been expanding over time. The rates from 15 years ago are pretty meaningless. The deterrence effect is diminished when we go back so far. As more people become gun owners "politeness" increases. The last 5 years in Idaho have had lower rates than most all years prior, plus we're dealing with a small population base so year by year spikes of a few additional murders are going to show significant change in the state-wide statistics.
That's why statisticians don't use a single year.
Gun ownership has always been easier in Idaho than it has been in Canada. And the murder rate has almost always been significantly higher.
More Canadian data for 2010 broken down by province.
Nova Scotia = 2.22
Ontario= 1.43
Manitoba = 3.64
Saskatchewan = 3.26
British Columbia = 1.83
Yukon = 2.89
NWT = 2.28
Nunavit = 18.28 (not a typo)
Idaho, again, was 1.4.
Again, that's one single year. Over time, the murder rate has been higher in white, gun-toting Idaho than in Canada.
Why is Idaho so special?
Here are the homicide rates in New Hampshire, a state with a 1.5% black population and so this puts us into the homicide rate territory of Germany and France:
1990 = 1.9
1991 = 3.6
1992 = 1.6
1883 = 2.0
1994 = 1.4
1995 = 1.8
1996 = 1.7
1997 = 1.4
1998 = 1.5
1999 = 1.5
2000 = 1.8
2001 = 1.3
2002 = 0.9
2003 = 1.3
2004 = 1.3
2005 = 1.5
2006 = 1.0
2007 = 1.1
2008 = 1.1
2009 = 0.8
2010 = 1.0
2011 = 1.2
2012 = 1.1
More Canadian data for 2010 broken down by province.
Nova Scotia = 2.22
Ontario= 1.43
Manitoba = 3.64
Saskatchewan = 3.26
British Columbia = 1.83
Yukon = 2.89
NWT = 2.28
Nunavit = 18.28 (not a typo)
It's not "more" Canadian data. It's the "same" Canadian data you post over and over again. Cherry-picking one year out of 40 doesn't support your argument. It's like your team going 3-37 over the past 40 games against the same team, and picking out one game you won and claiming your team is better than the other team despite losing 37 of the 39 other games.
The reason why I picked Idaho is because it is 93% white, small, and has lots of guns. Your post about NH is fair. However, it doesn't change the fact that the rate of murder in white Idaho where there are lots of guns is greater than Canada's. The murder rate for white America is still ~2x greater than all of Canada according to your post here.
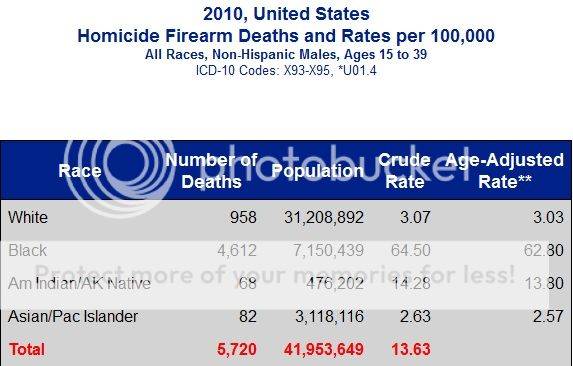
On the prairies and in the territories, the murder rate is high because of the high Native population of ~10%. Nunavut, for example, has 30,000 people, 85% which are Native. That approximates with the murder rate in your graphic of 14/100k in the US.
Idaho is not 93% white for that category includes Latin American Hispanics. Idaho is 83% non-Hispanic white.
So just as you point out the higher Native homicide rate in Canada, Idaho and the rest of America, are also contending with a higher Hispanic homicide rate, a 4x+ higher rate for Hispanic males than for non-Hispanic white males. Idaho also have a higher Native American presence than the US as a whole, and that demographic group has a homicide rate which is 5x greater than non-Hispanic whites.
New Hampshire is pretty damn white and it's homicide rate matches Frances and Germany and beats Ontario too.
And I'm not cherry picking one year of data, I supplied New Hampshire homicide rate data for every year since 1990. Here it is again:
1990 = 1.9
1991 = 3.6
1992 = 1.6
1883 = 2.0
1994 = 1.4
1995 = 1.8
1996 = 1.7
1997 = 1.4
1998 = 1.5
1999 = 1.5
2000 = 1.8
2001 = 1.3
2002 = 0.9
2003 = 1.3
2004 = 1.3
2005 = 1.5
2006 = 1.0
2007 = 1.1
2008 = 1.1
2009 = 0.8
2010 = 1.0
2011 = 1.2
2012 = 1.1
1991 = 3.6
1992 = 1.6
1883 = 2.0
1994 = 1.4
1995 = 1.8
1996 = 1.7
1997 = 1.4
1998 = 1.5
1999 = 1.5
2000 = 1.8
2001 = 1.3
2002 = 0.9
2003 = 1.3
2004 = 1.3
2005 = 1.5
2006 = 1.0
2007 = 1.1
2008 = 1.1
2009 = 0.8
2010 = 1.0
2011 = 1.2
2012 = 1.1