Hey Crick..... 
Nobody cares about "misinformation". The debate ended months ago.
Nobody cares about "misinformation". The debate ended months ago.
Follow along with the video below to see how to install our site as a web app on your home screen.

Note: This feature currently requires accessing the site using the built-in Safari browser.
Pretty stupid comment. Just more lies from a "Conservative".Where is the actual "published" paper?
They say it is published here,
"Proceedings of the National Academy of Sciences"
Cambridge written article posted this at the bottom of the article:
Reference: “Rapid basal melting of the Greenland Ice Sheet from surface meltwater drainage” 21 February 2022, Proceedings of the National Academy of Sciences.
DOI: 10.1073/pnas.2116036119
Looked for the paper using the Information it goes right back to your article or science daily which is a copy of your article.


 www.pnas.org
Ol' Skook is finally gone completely around the bend.Lol....fully vaccinated in the US stuck on 58% for several weeks now. Indeed....who are the idiots now?
120 million Americans love their "misinformation". Never rolling up their sleeves....and taking bows every day now btw as the vaccinated falling like flies everywhere, except of course, in the US. dOy
Waaaaay more jabbed dying of Covid now....two out of every three, in fact. Pfizer and Moderna....Wall St awake. Stocks cratering. Life Insurance companies now not paying on policies of the jabbed...."death by suicide".
In the coming months, as the truth continues to trickle out, the deep matrix dwelling knuckle draggers will know they've been bamboozled. Hopelessly so....and I'm laughing....told the bobbleheads a FULL YEAR AGO they were being duped.
Now the data...ummm....not debatable.
120,000,000 ( count those zeros)
View attachment 605064
Hey Crick.....
Nobody cares about "misinformation". The debate ended months ago.
How about some links supporting your claim here?
Someone that is not a total dumb fuck could find that in only about 2 seconds.Where is the link to that allegedly published paper mentioned in post one article?
Your hypocrisy is showing up again....
www.pnas.org
And when the salt water starts lapping at their doors, they can just move to one of their mansions elsewhere. So they are enjoying that area while it exists.Just read the papers silly boi. Martha's Vineyard is FULL of the elite.
They don't seem to worried at all.
And when the salt water starts lapping at their doors, they can just move to one of their mansions elsewhere. So they are enjoying that area while it exists.
You mean other than them including the urban heat island effect and using the low variability solar output dataset instead of the high variability solar output dataset used by the team in charge of NASA’s ACRIM sun-monitoring satellites.With whom is it a failed theory? Certainly not with the published data on which AR6 is based.
Someone that is not a total dumb fuck could find that in only about 2 seconds.
Rapid basal melting of the Greenland Ice Sheet from surface meltwater drainage
Subglacial drainage systems control ice sheet flow and the quantity of ice discharged into the ocean. However, these systems are currently poorly characterized, from a lack of direct observations. This shortcoming is problematic, as changes in drainage systems can result in a markedly...
The record is unprecedented because the observed basal melt rates are several orders of magnitude higher than predictions and previous estimates.
Pretty stupid comment. Just more lies from a "Conservative".
Significance
Subglacial drainage systems control ice sheet flow and the quantity of ice discharged into the ocean. However, these systems are currently poorly characterized, from a lack of direct observations. This shortcoming is problematic, as changes in drainage systems can result in a markedly differently ice sheet response. Here, we present a radar-derived record of basal melt rates with colocated borehole observations, showing unexpectedly warm subglacial conditions beneath a large outlet glacier in West Greenland. The record is unprecedented because the observed basal melt rates are several orders of magnitude higher than predictions and previous estimates. Our observations show that the effect of viscous dissipation from surface meltwater input is by far the largest heat source beneath the Greenland Ice Sheet.
Rapid basal melting of the Greenland Ice Sheet from surface meltwater drainage
Subglacial drainage systems control ice sheet flow and the quantity of ice discharged into the ocean. However, these systems are currently poorly characterized, from a lack of direct observations. This shortcoming is problematic, as changes in drainage systems can result in a markedly...
Let's go down the same path I just went with good ol' Gunny. Why should the UHI heating not be included in an effort to ascertain the average temperature of the planet? As to solar output, check out this graphic. Note the magnitude of solar changes.
View attachment 605419


 )
)That didn't address what I wrote. Including the urban heat island effect and using the low variability solar output dataset instead of the high variability solar output dataset is how they reached their conclusions. An opposite conclusion is reached if the urban heat island effect is excluded and the high variability solar output dataset is used.Let's go down the same path I just went with good ol' Gunny. Why should the UHI heating not be included in an effort to ascertain the average temperature of the planet? As to solar output, check out this graphic. Note the magnitude of solar changes.
View attachment 605419
Because it is disingenuous to attribute that effect to CO2.Why should the UHI heating not be included in an effort to ascertain the average temperature of the planet?
Noted. Now explain how these temperature fluctuations occurred without using solar output.As to solar output, check out this graphic. Note the magnitude of solar changes.
The vast majority of the meltwater from the surface of the Greenland ice sheet descends through fissures and cracks to the base of the sheet over a kilometer below. The gravitic potential energy as well as the friction experienced by the flow is converted almost entirely to massive amounts of thermal energy that is melting the ice sheet from the bottom at a tremendous rate.
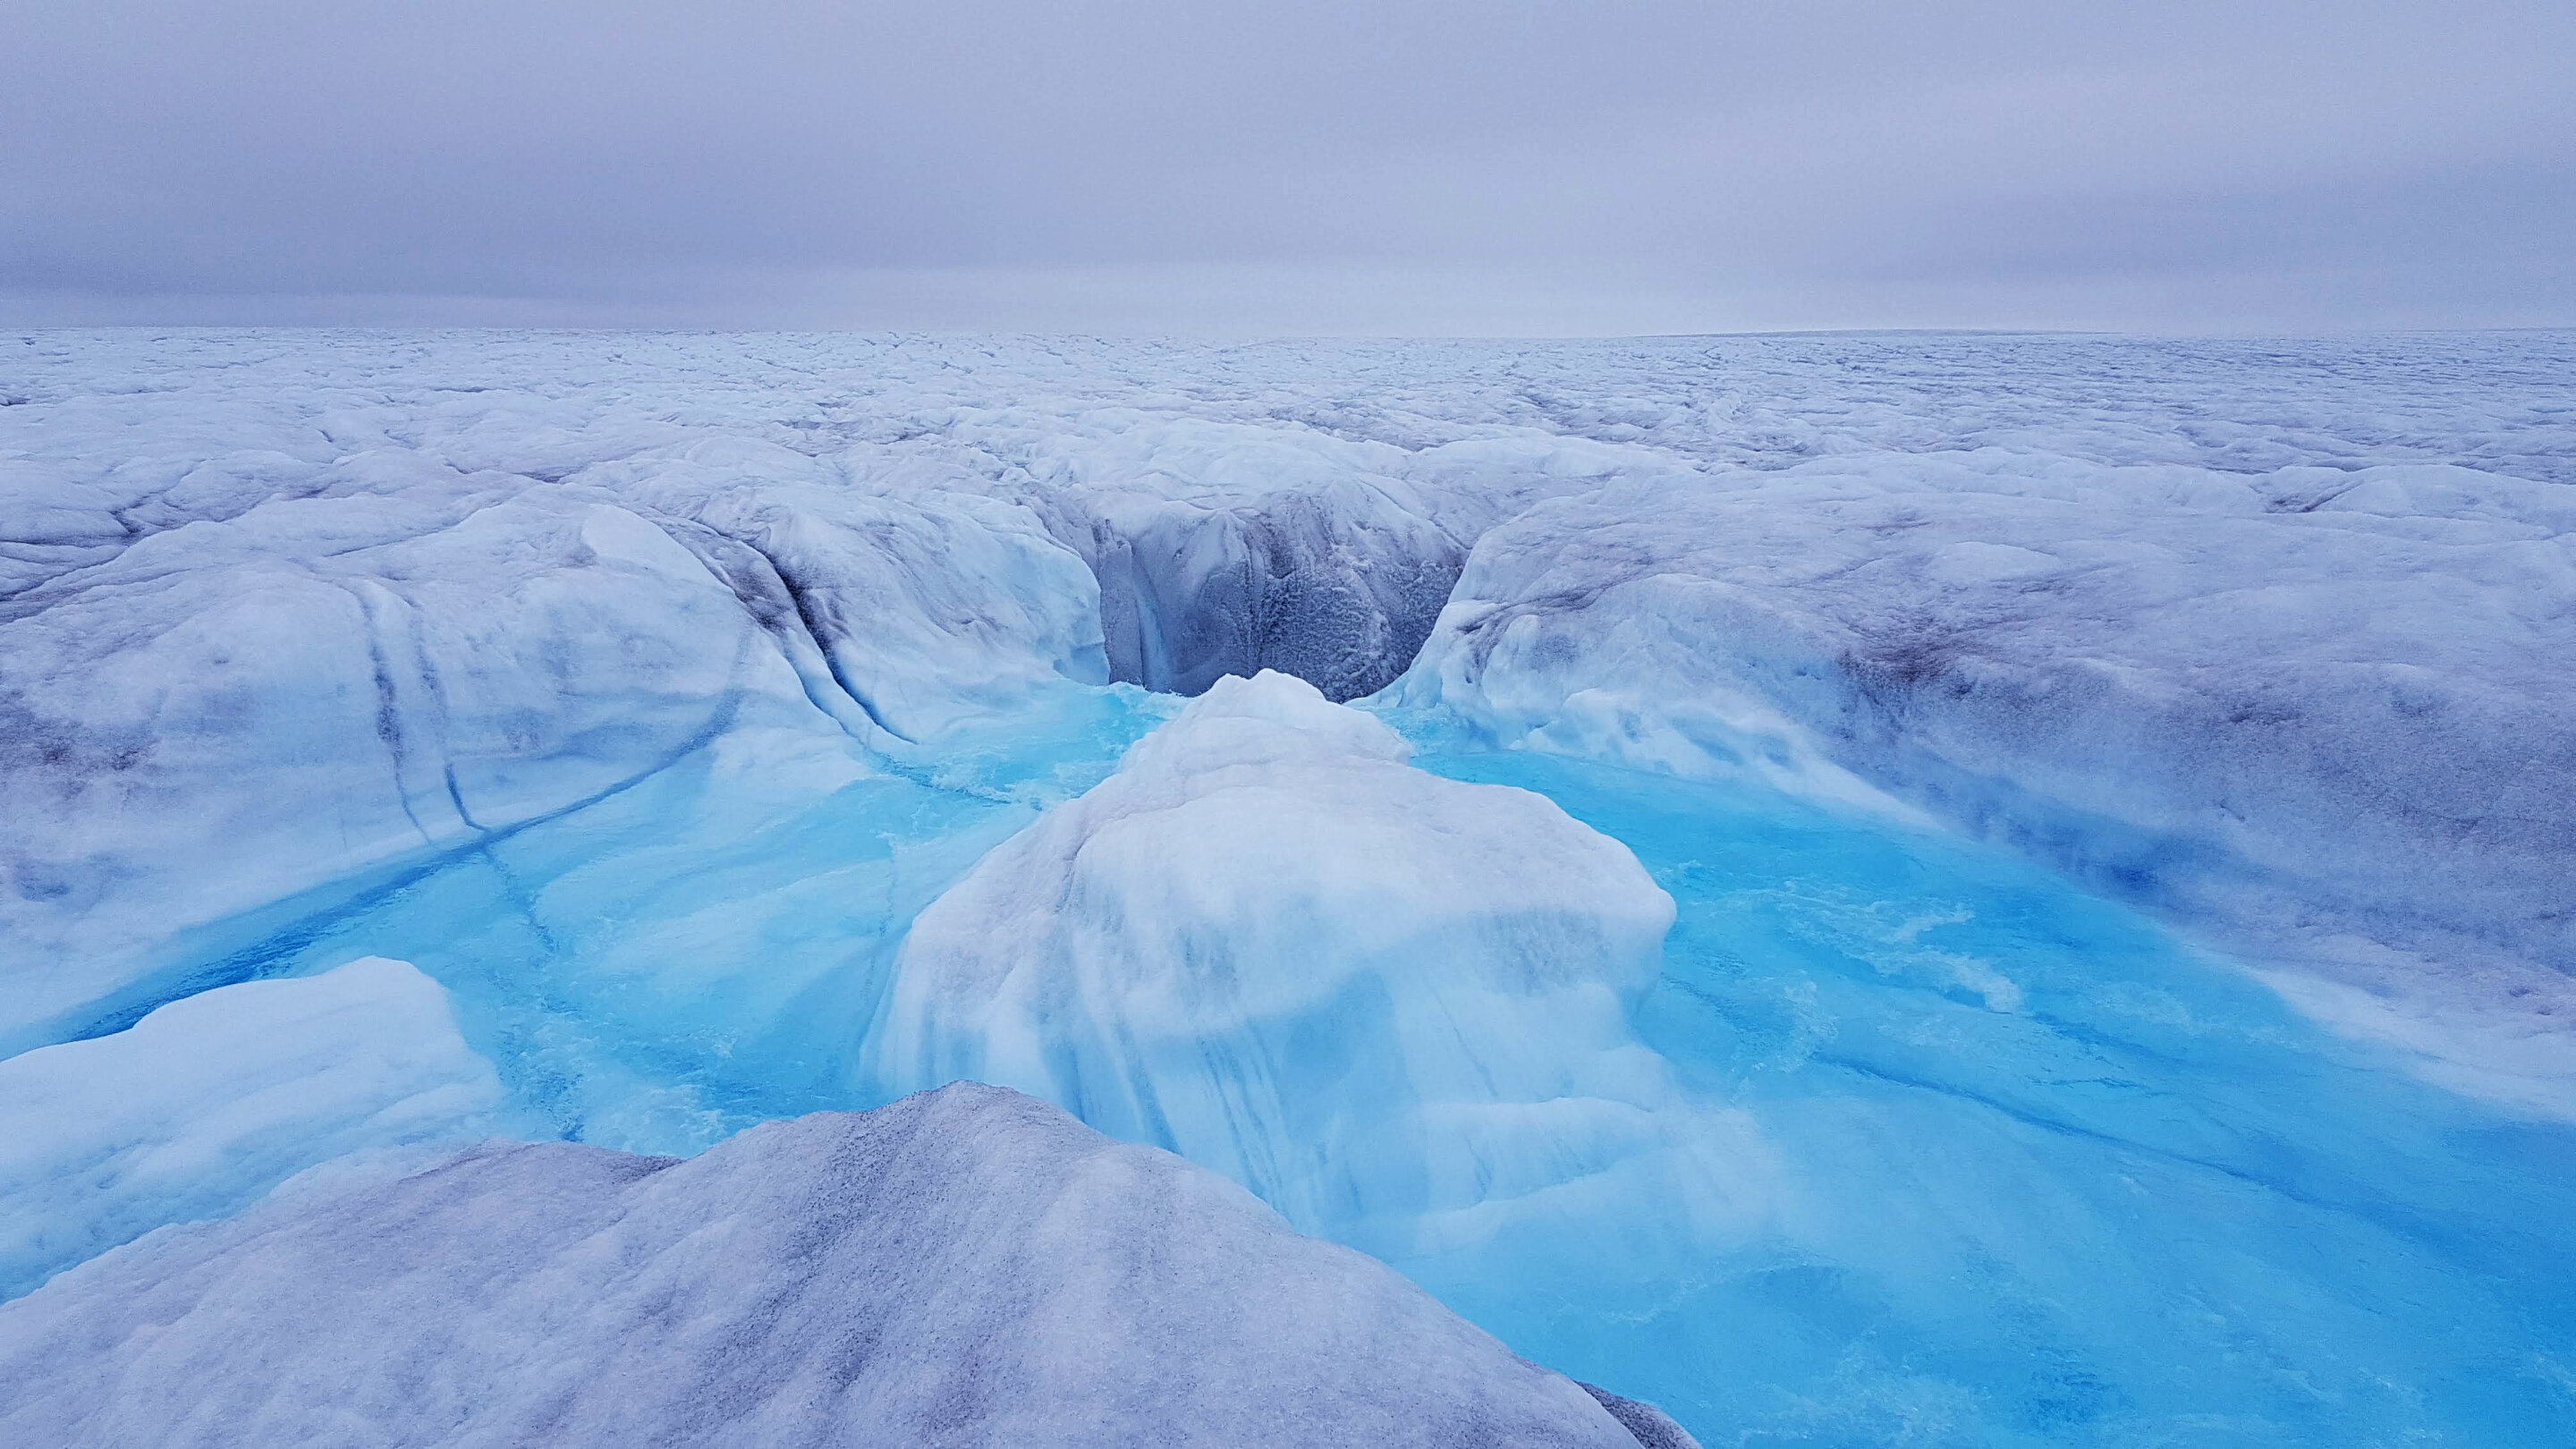
Accelerating melt rate makes Greenland Ice Sheet world's largest 'dam'
Researchers have observed extremely high rates of melting at the bottom of the Greenland Ice Sheet, caused by huge quantities of meltwater falling from the surface to the base. As the meltwater falls, energy is converted into heat in a process like the hydroelectric power generated by large dams.phys.org
