ScienceRocks
Democrat all the way!
- Banned
- #1
We're within the deepest solar minimum since 1910-1912, which was solar cycle 14th and was only slightly longer over all then 23. Scienctist believe that events like the Maunder Minimum was the main negative forcing that helped make the little ice age that was -.8 to -1.0c below "todays" 1951-1980 avg...But didn't get that cold within one solar grand minimum, but many over 400 years. So it compounds into its self.
Lets say that this minimum we're in has already taken away -.1c, which makes sense that years like 2010 with weaker el nino's can rank with 1998, which was a beast and most powerful el nino in recorded history. To make matters clear area 3.4, which scientist measure these things in 1998 was near 2.8c, but march 2010 the peak of the last el nino was near 1.8c...One whole degree "C" below 1998, but this year kicked its ass. Why even within a solar minimum that can within a few years take -.1c off the earth's temperature can a weaker nino do that and why; you guessed it->.15c of global warming over the last decade. The question now lays on how strong la nina gets throughout the rest of this year rather we will see second place with 1998 had close to strong and we're strong now and growing in strength as the pacific cools...I think we will be close, but 2005 fall was much warmer so it might hold onto the record.
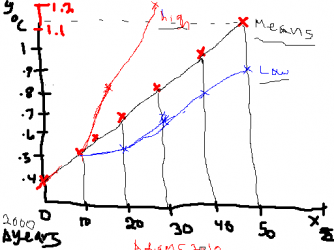
Sure the longer it last we will see compounding effects, which will mask the effects. I'd bet the compounding effects by 2020 "if" the solar minimum is still around then will be near .25c to .3c...Sure we could be seeing global records with weaker el nino's then, but the full effect will be masked. So when ever we get out of it and find out the true strength of global warming. Might come as a shock!
Lets say that this minimum we're in has already taken away -.1c, which makes sense that years like 2010 with weaker el nino's can rank with 1998, which was a beast and most powerful el nino in recorded history. To make matters clear area 3.4, which scientist measure these things in 1998 was near 2.8c, but march 2010 the peak of the last el nino was near 1.8c...One whole degree "C" below 1998, but this year kicked its ass. Why even within a solar minimum that can within a few years take -.1c off the earth's temperature can a weaker nino do that and why; you guessed it->.15c of global warming over the last decade. The question now lays on how strong la nina gets throughout the rest of this year rather we will see second place with 1998 had close to strong and we're strong now and growing in strength as the pacific cools...I think we will be close, but 2005 fall was much warmer so it might hold onto the record.
Sure the longer it last we will see compounding effects, which will mask the effects. I'd bet the compounding effects by 2020 "if" the solar minimum is still around then will be near .25c to .3c...Sure we could be seeing global records with weaker el nino's then, but the full effect will be masked. So when ever we get out of it and find out the true strength of global warming. Might come as a shock!
Last edited:
 Of course it could be lower...If solar output and AMO team up, but with what we know I think it is pretty good.
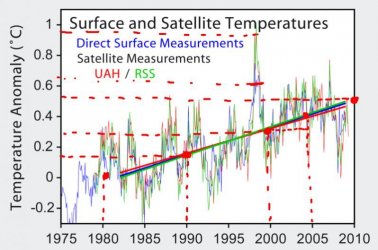
 There is a real world out there.............which dictates that, unless you're a fukking k00k, you're not going to voluntarily smash your head against a brick wall 100 times based upon some scientists prediction that it will rain in 127 days, 14 hours and 32 seconds!!!
") rising from the surface. The warmed air radiates some of the energy back down to the surface, helping it stay warm. This was the effect that would later be called, by an inaccurate analogy, the "greenhouse effect." The equations and data available to 19th-century scientists were far too poor to allow an accurate calculation. Yet the physics was straightforward enough to show that a bare, airless rock at the Earth's distance from the Sun should be far colder than the Earth actually is. Tyndall set out to find whether there was in fact any gas in the atmosphere that could trap heat rays. In 1859, his careful laboratory work identified several gases that did just that. The most important was simple water vapor (H2O). Also effective was carbon dioxide (CO2), although in the atmosphere the gas is only a few parts in ten thousand. Just as a sheet of paper will block more light than an entire pool of clear water, so the trace of CO2 altered the balance of heat radiation through the entire atmosphere. (For a more complete explanation of how the "greenhouse effect" works, follow the link at right to the essay on Simple Models of Climate.)(1)
rising from the surface. The warmed air radiates some of the energy back down to the surface, helping it stay warm. This was the effect that would later be called, by an inaccurate analogy, the "greenhouse effect." The equations and data available to 19th-century scientists were far too poor to allow an accurate calculation. Yet the physics was straightforward enough to show that a bare, airless rock at the Earth's distance from the Sun should be far colder than the Earth actually is. Tyndall set out to find whether there was in fact any gas in the atmosphere that could trap heat rays. In 1859, his careful laboratory work identified several gases that did just that. The most important was simple water vapor (H2O). Also effective was carbon dioxide (CO2), although in the atmosphere the gas is only a few parts in ten thousand. Just as a sheet of paper will block more light than an entire pool of clear water, so the trace of CO2 altered the balance of heat radiation through the entire atmosphere. (For a more complete explanation of how the "greenhouse effect" works, follow the link at right to the essay on Simple Models of Climate.)(1)