The rightwingnut fruitloops started out stating that there was no warming going on at all. When the warming became evident enough that all could see that they were totally wrong, they changed over to 'but it's all natural'. Now that they have been called out on the fact that there are no natural forcing to account for the increase in temperature in the atmosphere and ocean, they have gone to a two pronged attack.
One, well, who are those scientists to tell us what temperature is best, in any case. Total admission that AGW is a fact, and only saying that 'Try it, you might like it'. Of course, the increase in extreme weather events is affecting enough people and nations that this is becoming untenable, as the world's population is finding that they really don't like it.
Two. All these scientists from all the different nations and cultures are in on a gigantic conspiracy, one so tightly knit that no one has come forward to reveal the nature or purpose of this conspiracy. The old tin hat stuff that the rightwingnutjobs thrive on. And the rest of us find amazingly humorous. The same way a drunk harmless old uncle is humored in his nonsensical ramblings.
As the agreement in Paris has demonstrated, the nut jobs have lost, and the President's budget, including the funds for meeting the agreed targets, passed. One more time you fruitloops lose.
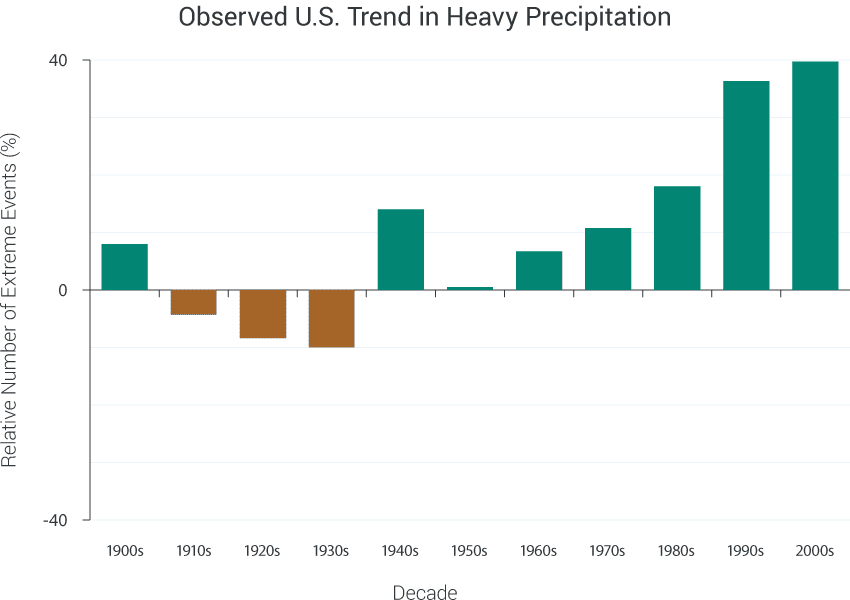
Of course, the increase in extreme weather events is affecting enough people and nations that this is becoming untenable, as the world's population is finding that they really don't like it.
When was this magical period in history when we had no extreme weather?
How exactly did we determine the proper number of extreme weather events, so we'd know that the number we have now is abnormally high?