Koios
Recreational Kibitzer
- Nov 12, 2012
- 2,841
- 117
- 48
Even your own link says that Antarctica isn't melting.
Presicely. It cannot be global warming if Antarctica is still cold.
Good thinking.
Follow along with the video below to see how to install our site as a web app on your home screen.
Note: This feature may not be available in some browsers.
Even your own link says that Antarctica isn't melting.
No, but you sure could be and probably are. Or, alternatively, you could just really be that retarded. We've been talking about ice mass losses from the Antarctic ice sheets and ice shelves and you are so out of it and clueless that you first mutter something idiotic about: "a supposedly 11mm loss over the decade" when the actual info I posted talked about "melting Antarctic and Greenland ice sheets have added 11.1mm (0.43") to global sea levels since 1992", and then you post a thumbnail chart of 'Antarctic sea ice extent'. LOL. Are you still totally in the dark about the difference between the fairly small fringe of about six foot thick sea ice that forms and melts away yearly around parts of the Antarctic coastlines and whose total volume is not very significant, and the miles thick sheets of solid ice that cover this five and a half million square mile continent and that hold about 70% of all the world's fresh water. LOL. You are such a clueless retard. Pretty funny to watch your mind 'work' at times though.Interesting how there is a supposedly 11mm loss over the decade when the ice extent shows ABOVE the 1979-2000 average for the past year and a half.I think you may be misinterpreting what was said. Let's look at everything they said instead of trying to cherry-pick one quote that you imagine supports your denial of AGW.Even your own link says that Antarctica isn't melting.
"melting Antarctic and Greenland ice sheets have added 11.1mm (0.43") to global sea levels since 1992"
"The use of data from NASA and ESA satellites have confirmed that both Antarctica and Greenland are losing ice"
"The combined melting of both the Antarctic and Greenland ice sheets accounted for one-fifth of all sea level rises over the 20-year survey period"
"The rate at which the ice sheets are melting was also seen to rise over the study period, with both Antarctica and Greenland shedding more than three times as much ice each year as they were in the 1990s"
""The rate of ice loss from Greenland has increased almost five-fold since the mid-1990s" said NASA's Erik Ivins, co-author on the study. "In contrast, ...in Antarctic ice..., the overall balance has remained fairly constant""
It seems to me that she's comparing the rate of ice loss from Greenland to the rate of ice loss in the Antarctic and saying, rather incompletely, that the balance between rate of gains in ice mass in the interior of Antarctica due to the increased snowfall resulting from global warming is staying in about the same ratio to the larger loss of ice mass around the coast of Antarctica and isn't yet showing quite the same acceleration of ice loss as the Greenland ice sheet. The scientists are quite clear that Antarctica is, in fact, losing ice mass.

Source: NASA - Is Antarctica Melting?
They couldn't possibly be lying now could they....
the interesting part about Antarctic ice cap loss estimates is that they started off very large but with an equally large margin of error. as measurement methods and data points increased, the precision the estimates have come down dramatically. add to that, NASA says that there is a very real problem with lack of stable benchmarks to compare altimetry data, and you have an unknown accuracy component.
every parameter that IPCC uses to buttress the CAGW theory has been shown to be exaggerated by dodgy methodologies and assumptions. science does indeed make self corrections over time, and weeds out poor papers and articles. it has been pretty obvious over the last few years that most or all of the catastrophic papers have been crushed with open review of data and methods. MBH98&99 would be laughed at now rather than become the poster child of the IPCC. this week the IPCC second draft was released to the public because certain scientists were upset that much information was being ignored or distorted. climategate was all about a whistleblower being pissed off at the overbearing and underhanded dealings of IPCC's AR4. once published, it is impossible to take back. the public deserves better and is getting better this time around.
The obvious concern to this reviewer, who has measured total column water vapor for 22.5 years, is the absence of any mention of the 2012 NVAP-M paper. This paper concludes,
Therefore, at this time, we can neither prove nor disprove a robust trend in the global water vapor data.
Non-specialist readers must be made aware of this finding and that it is at odds with some earlier papers. Many cited papers in AR5 have yet to be published, but the first NVAP-M paper was published earlier this year (after the FOD reviews) and is definitely worthy of citation: Thomas H. Vonder Haar, Janice L. Bytheway and John M. Forsythe. Weather and climate analyses using improved global water vapor observations. GEOPHYSICAL RESEARCH LETTERS, VOL. 39, L15802, 6 PP., 2012. doi:10.1029/2012GL052094.
This study shows no up or down trend in global water vapor, a finding of major significance that differs with studies cited in AR5. Climate modelers assume that water vapor, the principle greenhouse gas, will increase with carbon dioxide, but the NVAP-M study shows this has not occurred. Carbon dioxide has continued to increase, but global water vapor has not. Today (December 14, 2012) I asked a prominent climate scientist if I should release my review early in view of the release of the entire second draft report.
He suggested that I do so, and links to the official IPCC spreadsheet version and a Word version of my review are now posted near the top of my homepage at Forrest M. Mims III.
Mauna Loa?...You mean that great big CO2 spewing volcano?So??????? What relevance does that have, in your imagination, to the increased melting of the polar ice sheets? Or are you just trying to demonstrate how clueless you are, again.
So, CO2 is decreasing but we still have the big melt.
Seems like you got some splainin' to do.
"CO2 is decreasing"?????? LOLOLOLOL. Not on this planet, you poor retarded crackpot. Try learning to read. Ooops, that's right, you're retarded so you are incapable of comprehending what you read. Too bad for you. Here's a clue - CO2 emissions in one country decreasing slightly over previous years does not equal decreasing worldwide atmospheric CO2 levels.
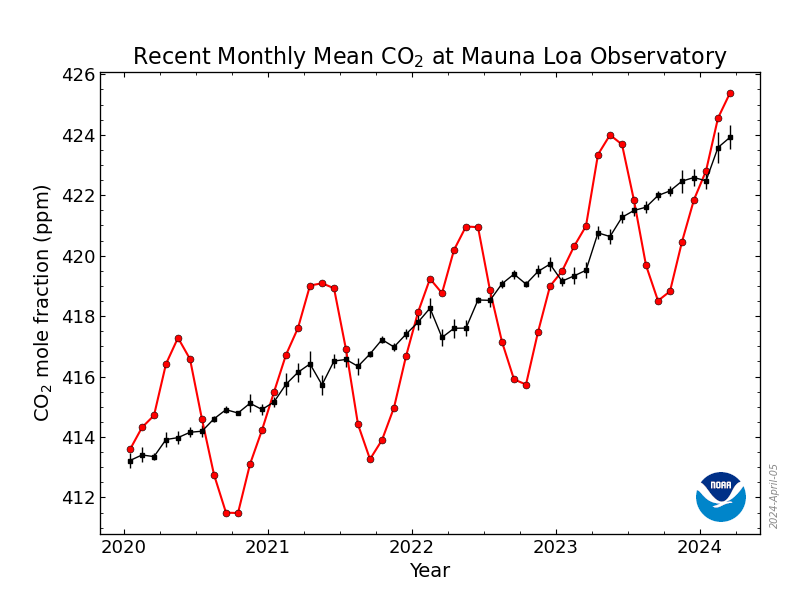
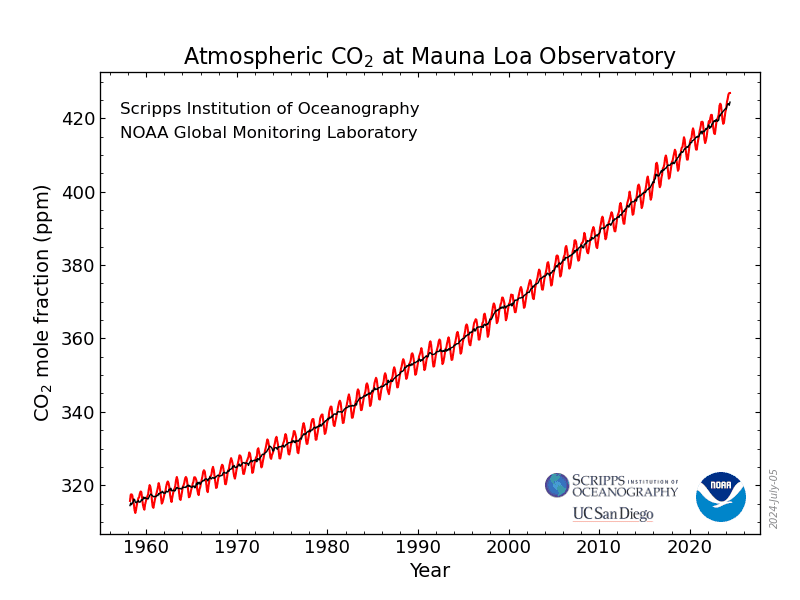
Source: Trends in Atmospheric Carbon Dioxide - US National Oceanic and Atmospheric Administration (NOAA)

the interesting part about Antarctic ice cap loss estimates is that they started off very large but with an equally large margin of error. as measurement methods and data points increased, the precision the estimates have come down dramatically. add to that, NASA says that there is a very real problem with lack of stable benchmarks to compare altimetry data, and you have an unknown accuracy component.
every parameter that IPCC uses to buttress the CAGW theory has been shown to be exaggerated by dodgy methodologies and assumptions. science does indeed make self corrections over time, and weeds out poor papers and articles. it has been pretty obvious over the last few years that most or all of the catastrophic papers have been crushed with open review of data and methods. MBH98&99 would be laughed at now rather than become the poster child of the IPCC. this week the IPCC second draft was released to the public because certain scientists were upset that much information was being ignored or distorted. climategate was all about a whistleblower being pissed off at the overbearing and underhanded dealings of IPCC's AR4. once published, it is impossible to take back. the public deserves better and is getting better this time around.
the latest IPCC reviewer has this to say-
The obvious concern to this reviewer, who has measured total column water vapor for 22.5 years, is the absence of any mention of the 2012 NVAP-M paper. This paper concludes,
Therefore, at this time, we can neither prove nor disprove a robust trend in the global water vapor data.
Non-specialist readers must be made aware of this finding and that it is at odds with some earlier papers. Many cited papers in AR5 have yet to be published, but the first NVAP-M paper was published earlier this year (after the FOD reviews) and is definitely worthy of citation: Thomas H. Vonder Haar, Janice L. Bytheway and John M. Forsythe. Weather and climate analyses using improved global water vapor observations. GEOPHYSICAL RESEARCH LETTERS, VOL. 39, L15802, 6 PP., 2012. doi:10.1029/2012GL052094.
This study shows no up or down trend in global water vapor, a finding of major significance that differs with studies cited in AR5. Climate modelers assume that water vapor, the principle greenhouse gas, will increase with carbon dioxide, but the NVAP-M study shows this has not occurred. Carbon dioxide has continued to increase, but global water vapor has not. Today (December 14, 2012) I asked a prominent climate scientist if I should release my review early in view of the release of the entire second draft report.
He suggested that I do so, and links to the official IPCC spreadsheet version and a Word version of my review are now posted near the top of my homepage at Forrest M. Mims III.
notice that this reviewer is accusing the IPCC of the same thing they were guilty of last time around? they ignore published papers that dont support their position, and they cite papers that are not published yet ( or in the case of Gergis et al, withdrawn in shame papers).
http://wattsupwiththat.com/2012/12/14/another-ipcc-ar5-reviewer-speakshttp://wattsupwiththat.com/2012/12/14/another-ipcc-ar5-reviewer-speaks-out-no-trend-in-global-water-vapor/-out-no-trend-in-global-water-vapor/
NASA Water Vapor Project (NVAP)
The NASA MEaSUREs program began in 2008 and has the goal of creating stable, community accepted Earth System Data Records (ESDRs) for a variety of geophysical time series. A reanalysis and extension of the NASA Water Vapor Project (NVAP), called NVAP-M is being performed as part of this program.
HistoryData characteristicsSample resultsReferences and CitationsUpcoming PresentationsFAQLinksContact us
History
NVAP began in the early 1990s as a NASA Pathfinder project to create a record of the distribution of Earth's water vapor on a daily basis. Since its inception, there have been several extensions of NVAP, growing the dataset to include 14 years (1988-2001) of gridded total column and layered water vapor over both ocean and land. When processing is complete, NVAP-M will span 1987-2010.
The NVAP dataset is designed to be model-independent and relies mainly on satellite measurements; however historically, rawinsonde data has also been included. Early versions of NVAP included layered and total column water vapor on a 1 x 1 degree grid combining water vapor measurements from radiosondes, the TIROS Operational Vertical Sounder (TOVS) and Special Sensor Microwave / Imager (SSM/I), while the "next generation" dataset, NVAP-NG (2000-2001), added data from the Advanced Microwave Sounding Unit (AMSU) and Special Sensor Microwave / Temperature-2 (SSM/T2) on a 0.5 x 0.5 degree grid. Retrieved atmospheric water vapor values from each instrument were merged using a simplistic weighting scheme based on the perceived accuracy of each measurement. Gaps due to non-existent or bad data were filled using spatial and temporal averaging techniques.
Many time dependent biases exist in the heritage NVAP dataset due to algorithm changes and the addition/subtraction of instruments (shown above). Use of consistent algorithms through time should remove these. Many new sources of data have been added since the last phase of NVAP. Many existing data sources have been reanalyzed themselves, producing more stable, climate quality sources of TPW.
Project Status
August, 2012:
The NVAP-M team released a preliminary Beta Test Version of the dataset to selected users with significant experience using water vapor data in late 2011. A six-month no-cost extension to implement test-user suggestions and finalize the dataset was approved in early 2012. NVAP-M will be transferred to the NASA Langley Atmospheric Science Data Center (ASDC) in fall 2012. The NVAP-M team continues to publicize the dataset at professional meetings and conferences and hopes to participate in the Annual Meeting of the American Geophysical Union as well as the 93rd Annual Meeting of the American Meteorological Society. First results of the dataset were also recently published in Geophysical Research Letters.
Last updated on Aug 7, 2012
SCAR ISMASS Workshop, July 14, 2012
Mass Gains of the Antarctic Ice Sheet Exceed LossesH. Jay Zwally'. Jun Li', John Robbins2, Jack 1. Saba2, Donghui Yi', Anita Brenner', and David
Bromwich4
Abstract
During 2003 to 2008, the mass gain of the Antarctic ice sheet from snow accumulation exceeded
the mass loss from ice discharge by 49 Gtlyr (2.5% of input), as derived from ICESat laser
measurements of elevation change. The net gain (86 Gtlyr) over the West Antarctic (WA) and
East Antarctic ice sheets (W A and EA) is essentially unchanged from revised results for 1992 to
2001 from ERS radar altimetry. Imbalances in individual drainage systems (DS) are large
(-68% to +103% of input), as are temporal changes (-39% to +44%). The recent 90 Gtlyr loss
from three DS (Pine Island, Thwaites-Smith, and Marie-Bryd Coast) of WA exceeds the earlier
61 Gtlyr loss, consistent with reports of accelerating ice flow and dynamic thinning. Similarly,
the recent 24 Gtlyr loss from three DS in the Antarctic Peninsula (AP) is consistent with glacier
accelerations following breakup of the Larsen B and other ice shelves. In contrast, net increases
in the five other DS ofWA and AP and three of the 16 DS in East Antarctica (EA) exceed the
increased losses. Alternate interpretations of the mass changes driven by accumulation variations
are given using results from atmospheric-model re-analysis and a parameterization based on 5%
change in accumulation per degree of observed surface temperature change. A slow increase in
snowfall with climate wanning, consistent with model predictions, may be offsetting increased
dynamic losses.
for years I have been saying that the data for Antarctica have been 'pushed' in the 'right' direction and that sooner or later the findings were going to be in for a big correction. that time is now. when a rabid warmer that presented many of the alarmist papers showing large ice loss from Antarctica now reverses his direction and says that Antarctica is actually gaining mass then I tend to believe something big is going on. perhaps I am wrong and you are right RT but I think ice loss derived by altimetry has been seriously exaggerated and we shall be seeing more and more defections like the one by Zwally.
it is interesting that Zwally's 2011 and 2012 presentations have received no publicity at all.
Lots of studies but only the one that somewhat agrees with your ignorant opinions is valid, eh? LOL. Here's another study, different from the one cited in the OP.
Polar Ice Loss Is Accelerating, Scientists Say
The New York Times
By JOHN COLLINS RUDOLF
March 11, 2011
(excerpts)
On Wednesday, a research team led by a NASA scientist unveiled a new study that is sure to stir debate on the topic. The paper concludes that ice loss from both Greenland and Antarctica is accelerating, and that the ice sheets impact on the rise in sea levels in the first half of the 21st century will be substantially higher than previous studies had projected. The increasing ice loss means that, for the first time, Greenland and Antarctica appear to be adding more to sea-level rise than the worlds other reserves of ice primarily mountain glaciers, which are also melting because of rising temperatures. In 2006 alone, the study estimated that the two ice sheets lost roughly 475 billion metric tons of ice. The big deal is that we did not expect ice sheets to catch up with mountain glaciers so soon, said Eric Rignot, a climate researcher with NASAs Jet Propulsion Laboratory and the lead author of the study. If the rates of melting observed in the study were to continue, the ice sheets could add nearly six inches to the rise in global sea levels in the next forty years a far larger contribution than the United Nations Intergovernmental Panel on Climate Change, the international scientific body, has projected.
The studys findings that ice loss in Greenland has accelerated strikingly over the last two decades are largely in line with the conclusions of other researchers. But the estimate that Antarctica is also rapidly shedding ice was challenged by other scientists, who believe the continents ice sheet remains largely in balance. We think that their estimate of the loss from Antarctica is much too large, said Jay Zwally, a glaciologist with NASAs Goddard Space Flight Center. Dr. Zwally agreed that rapid warming on the Antarctic peninsula has quickened the flow of that regions glaciers into the sea, but said that other research showed increased snowfall in other areas had probably kept the ice sheets overall mass stable. Dr. Rignot said he stood by his conclusions about Antarctica, which were derived from data from two independent measurement techniques dating back 20 years.
***
If the rates of melting observed in the study were to continue, the ice sheets could add nearly six inches to the rise in global sea levels in the next forty years a far larger contribution than the United Nations Intergovernmental Panel on Climate Change, the international scientific body, has projected.
Granny says, "Dat's right...
... all dat polar ice gonna melt on Dec.21st...
... an' den it gonna cause a big ol' polar shift...
... from the shiftin' of the weight o' all dat polar ice dat ain't there no more...
... an' dat gonna cause a release of alla pent up CO2...
... dat's been trapped inna polar ice dat ain't there no more...
... an' den we ain't gonna be able to breathe `cause o' alla CO2 inna air...
... an' den we all gonna die just like dem dinosaurs did last time dis happened."
Were seeing the reality of a lot of the North Pole starting to evaporate, and we could get to a tipping point. Because if it evaporates to a certain point they have lanes now where ships can go that couldnt ever sail through before. And if it gets to a point where it evaporates too much, theres a lot of tundra thats being held down by that ice cap..

Demonstrating your rather meager comprehension abilities again, eh fecalhead?If the rates of melting observed in the study were to continue, the ice sheets could add nearly six inches to the rise in global sea levels in the next forty years a far larger contribution than the United Nations Intergovernmental Panel on Climate Change, the international scientific body, has projected.
First the IPCC comes in with a skeptical number, then TinkerBelle gives us 6.6FEET by 2100 in the OP ---- NOW --- we got 6 INCHES by 2050?????? Wow -- that next 50 years is gonna be rough..
Keep the office guessing pool at NASA.. There's no need to be whipping numbers out of your asses...
"If the rate of melting observed in the study were to continue..."....but then again, what if the rate increases as most climate scientists predict?
"the ice sheets could add nearly six inches to the rise in global sea levels in the next forty years" and the mountain glaciers and sea level glaciers and thermal expansion and groundwater mining will all add more inches. The process is accelerating as temperatures keep rising so the rate of sea level rise will keep accelerating as the century progresses.
"a far larger contribution than the (IPCC) has projected" and the significance of this completely escapes you. The melting ice and the rising sea levels (and many other climate change indicators) are all happening much faster than was predicted from the data they were using just a decade or two ago.
Demonstrating your rather meager comprehension abilities again, eh fecalhead?First the IPCC comes in with a skeptical number, then TinkerBelle gives us 6.6FEET by 2100 in the OP ---- NOW --- we got 6 INCHES by 2050?????? Wow -- that next 50 years is gonna be rough..
Keep the office guessing pool at NASA.. There's no need to be whipping numbers out of your asses...
"If the rate of melting observed in the study were to continue..."....but then again, what if the rate increases as most climate scientists predict?
"the ice sheets could add nearly six inches to the rise in global sea levels in the next forty years" and the mountain glaciers and sea level glaciers and thermal expansion and groundwater mining will all add more inches. The process is accelerating as temperatures keep rising so the rate of sea level rise will keep accelerating as the century progresses.
"a far larger contribution than the (IPCC) has projected" and the significance of this completely escapes you. The melting ice and the rising sea levels (and many other climate change indicators) are all happening much faster than was predicted from the data they were using just a decade or two ago.
IPCC: we redistribute wealth through climate policy
Demonstrating your rather meager comprehension abilities again, eh fecalhead?
"If the rate of melting observed in the study were to continue..."....but then again, what if the rate increases as most climate scientists predict?
"the ice sheets could add nearly six inches to the rise in global sea levels in the next forty years" and the mountain glaciers and sea level glaciers and thermal expansion and groundwater mining will all add more inches. The process is accelerating as temperatures keep rising so the rate of sea level rise will keep accelerating as the century progresses.
"a far larger contribution than the (IPCC) has projected" and the significance of this completely escapes you. The melting ice and the rising sea levels (and many other climate change indicators) are all happening much faster than was predicted from the data they were using just a decade or two ago.
IPCC: we redistribute wealth through climate policy
CrazyFruitcake: demonstrating severe retardation every day
kofkofff...ahemahem....Mauna Loa?...You mean that great big CO2 spewing volcano?So, CO2 is decreasing but we still have the big melt.
Seems like you got some splainin' to do.
"CO2 is decreasing"?????? LOLOLOLOL. Not on this planet, you poor retarded crackpot. Try learning to read. Ooops, that's right, you're retarded so you are incapable of comprehending what you read. Too bad for you. Here's a clue - CO2 emissions in one country decreasing slightly over previous years does not equal decreasing worldwide atmospheric CO2 levels.
Source: Trends in Atmospheric Carbon Dioxide - US National Oceanic and Atmospheric Administration (NOAA)
Now anthropogenically generated CO2 is causing volcanoes to emit more CO2?
Serially?

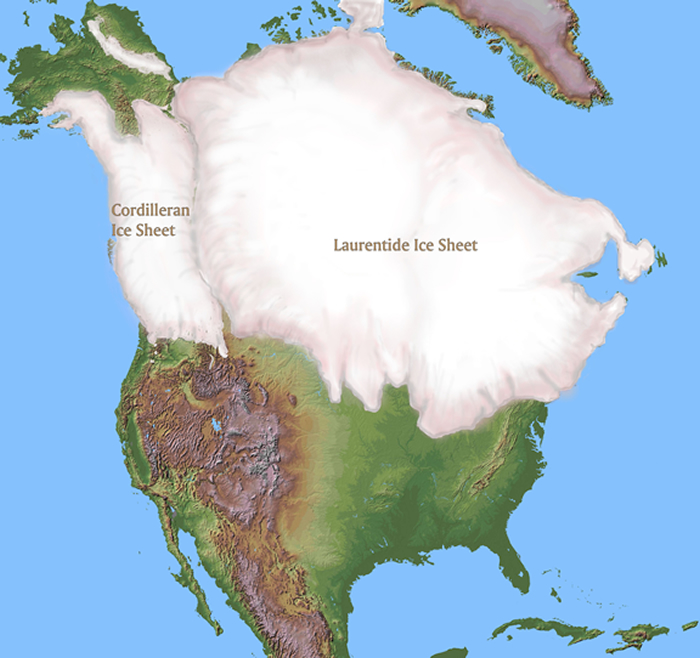
Oh Look the ice sheet is melting off of OhioCrazyFruitcake: demonstrating severe retardation every day
Oh Look the ice sheet is melting off of Michigan
Oh Look the ice sheet is melting off of Ontario
Oh Look the ice sheet is melting off of Hudson Bay
Oh Look the ice sheet is melting off of Nunavut
Mauna Loa?...You mean that great big CO2 spewing volcano?So, CO2 is decreasing but we still have the big melt.
Seems like you got some splainin' to do.
"CO2 is decreasing"?????? LOLOLOLOL. Not on this planet, you poor retarded crackpot. Try learning to read. Ooops, that's right, you're retarded so you are incapable of comprehending what you read. Too bad for you. Here's a clue - CO2 emissions in one country decreasing slightly over previous years does not equal decreasing worldwide atmospheric CO2 levels.
Source: Trends in Atmospheric Carbon Dioxide - US National Oceanic and Atmospheric Administration (NOAA)
Now anthropogenically generated CO2 is causing volcanoes to emit more CO2?
Serially?