Arctic Sea Ice Sets Record-Low Peak for Third Year

Same Shit Different Day (SSDD) has been denying the mountains of empirical and theoretical evidence since day 1. When pointed out to the nearly two thousand pages of it to be found in "The Physical Science Basis" by Working Group I of the IPCC, he will first try to tell us there is nothing there because we choose not to spoon feed it to him, then will claim it is not empirical and is all based on flawed models, then will claim all the temperature data is falsified.

He is useless.

What you have proven crick...is that you are unable to differentiate between evidence showing that the climate changes...and evidence showing a cause for the change...you provide evidence of a changing climate and assume that man must be the cause...I have asked for observed, measured, quantified, empirical evidence supporting the AGW hypothesis over natural variability...and neither you, nor any of your fellow glassy eyed cultist buds here...nor all of climate science can provide the first bit...

And your response is to A) lie your ass off because you know there is no such evidence in existence or B) prove beyond any doubt how f'ing stupid you are by providing post after post of material that may prove change, but doesn't even take the first step in proving cause.

I lean towards you being a f'ing stupid liar.

The climate changes and they claim they've eliminated all variables except for a teeny, tiny atmospheric trace element. But ask for one lab experiment and you get the most bizarre and insane reasons why they can't work in a lab
 
Same Shit Different Day (SSDD) has been denying the mountains of empirical and theoretical evidence since day 1. When pointed out to the nearly two thousand pages of it to be found in "The Physical Science Basis" by Working Group I of the IPCC, he will first try to tell us there is nothing there because we choose not to spoon feed it to him, then will claim it is not empirical and is all based on flawed models, then will claim all the temperature data is falsified.

He is useless.

What you have proven crick...
....is that you are a lying anti-science moron, SSoooDDumb!


...is that you are unable to differentiate between evidence showing that the climate changes...and evidence showing a cause for the change...you provide evidence of a changing climate and assume that man must be the cause...I have asked for observed, measured, quantified, empirical evidence supporting the AGW hypothesis over natural variability...
....and you have been shown that evidence over and over, but you continue to deny that evidence, like a good little denier cult wacko.


The climate changes and they claim they've eliminated all variables except for a teeny, tiny atmospheric trace element. But ask for one lab experiment and you get the most bizarre and insane reasons why they can't work in a lab

Nope! What you get, CrazyFruitcake, is lists of such experiments.....which you inevitably ignore and then deny that you have ever seen, like a good little brainwashed denier cult wacko.

Papers on laboratory measurements of CO2 absorption properties
Posted by Ari Jokimäki
September 25, 2009

This is a list of papers on laboratory measurements of the absorption properties of carbon dioxide. In the context of these paperlists this is a difficult subject because only few of the papers are freely available online, so we have to settle on abstracts only (of course, interested reader can purchase the full texts for the papers from the linked abstract pages). However, I don’t think that matters that much because the main point of this list really is to show that the basic research on the subject exists. The list is not complete, and will most likely be updated in the future in order to make it more thorough and more representative.

UPDATE (September 23, 2012): Burch & Gryvnak (1966) added.
UPDATE (February 6, 2011): Miller & Watts (1984) added.
UPDATE (July 25, 2010): I modified the introduction paragraph a little to reflect the current content of the list. The old text was a little outdated.
UPDATE (June 22, 2010): Lecher & Pernter (1881) added.
UPDATE (March 31, 2010): Tubbs & Williams (1972), Rubens & Aschkinass (1898) and Ångström (1900) added.
UPDATE (March 6, 2010): Barker (1922) added.
UPDATE (November 19, 2009): Predoi-Cross et al. (2007) added.
UPDATE (September 25, 2009): Miller & Brown (2004) added, thanks to John Cook for bringing it to my attention (see the discussion section below).

Spectroscopic database of CO2 line parameters: 4300–7000 cm−1 – Toth et al. (2008)“A new spectroscopic database for carbon dioxide in the near infrared is presented to support remote sensing of the terrestrial planets (Mars, Venus and the Earth). The compilation contains over 28,500 transitions of 210 bands from 4300 to 7000 cm−1…”

Line shape parameters measurement and computations for self-broadened carbon dioxide transitions in the 30012 ← 00001 and 30013 ← 00001 bands, line mixing, and speed dependence – Predoi-Cross et al. (2007) “Transitions of pure carbon dioxide have been measured using a Fourier transform spectrometer in the 30012 ← 00001 and 30013 ← 00001 vibrational bands. The room temperature spectra, recorded at a resolution of 0.008 cm−1, were analyzed using the Voigt model and a Speed Dependent Voigt line shape model that includes a pressure dependent narrowing parameter. Intensities, self-induced pressure broadening, shifts, and weak line mixing coefficients are determined. The results obtained are consistent with other studies in addition to the theoretically calculated values.” [Full text]

Spectroscopic challenges for high accuracy retrievals of atmospheric CO2 and the Orbiting Carbon Observatory (OCO) experiment – Miller et al. (2005) “The space-based Orbiting Carbon Observatory (OCO) mission will achieve global measurements needed to distinguish spatial and temporal gradients in the CO2 column. Scheduled by NASA to launch in 2008, the instrument will obtain averaged dry air mole fraction (XCO2) with a precision of 1 part per million (0.3%) in order to quantify the variation of CO2 sources and sinks and to improve future climate forecasts. Retrievals of XCO2 from ground-based measurements require even higher precisions to validate the satellite data and link them accurately and without bias to the World Meteorological Organization (WMO) standard for atmospheric CO2 observations. These retrievals will require CO2 spectroscopic parameters with unprecedented accuracy. Here we present the experimental and data analysis methods implemented in laboratory studies in order to achieve this challenging goal.”

Near infrared spectroscopy of carbon dioxide I. 16O12C16O line positions – Miller & Brown (2004) “High-resolution near-infrared (4000–9000 cm-1) spectra of carbon dioxide have been recorded using the McMath–Pierce Fourier transform spectrometer at the Kitt Peak National Solar Observatory. Some 2500 observed positions have been used to determine spectroscopic constants for 53 different vibrational states of the 16O12C16O isotopologue, including eight vibrational states for which laboratory spectra have not previously been reported. … This work reduces CO2 near-infrared line position uncertainties by a factor of 10 or more compared to the 2000 HITRAN line list, which has not been modified since the comprehensive work of Rothman et al. [J. Quant. Spectrosc. Rad. Transfer 48 (1992) 537].”[Full text]

Spectra calculations in central and wing regions of CO2 IR bands between 10 and 20 μm. I: model and laboratory measurements – Niro et al. (2004) “Temperature (200–300 K) and pressure (70–200 atm) dependent laboratory measurements of infrared transmission by CO2–N2 mixtures have been made. From these experiments the absorption coefficient is reconstructed, over a range of several orders of magnitude, between 600 and 1000 cm−1.”

Collisional effects on spectral line-shapes – Boulet (2004) “The growing concern of mankind for the understanding and preserving of its environment has stimulated great interest for the study of planetary atmospheres and, first of all, for that of the Earth. Onboard spectrometers now provide more and more precise information on the transmission and emission of radiation by these atmospheres. Its treatment by ‘retrieval’ technics, in order to extract vertical profiles (pressure, temperature, volume mixing ratios) requires precise modeling of infrared absorption spectra. Within this framework, accounting for the influence of pressure on the absorption shape is crucial. These effects of inter-molecular collisions between the optically active species and the ‘perturbers’ are complex and of various types depending mostly on the density of perturbers. The present paper attempts to review and illustrate, through a few examples, the state of the art in this field.”

On far-wing Raman profiles by CO2 – Benech et al. (2002) “Despite the excellent agreement observed in N2 here, a substantial inconsistency between theory and experiment was found in the wing of the spectrum. Although the influence of other missing processes or neighboring bands cannot be totally excluded, our findings rather suggest that highly anisotropic perturbers, such as CO2, are improperly described when they are handled as point-like molecules, a cornerstone hypothesis in the approach employed.”

Collision-induced scattering in CO2 gas – Teboul et al. (1995) “Carbon-dioxide gas rototranslational scattering has been measured at 294.5 K in the frequency range 10–1000 cm−1 at 23 amagat. The depolarization ratio of scattered intensities in the frequency range 10–1000 cm−1 is recorded. The theoretical and experimental spectra in the frequency range 10–470 cm−1 are compared.”

The HITRAN database: 1986 edition – Rothman et al. (1987) “A description and summary of the latest edition of the AFGL HITRAN molecular absorption parameters database are presented. This new database combines the information for the seven principal atmospheric absorbers and twenty-one additional molecular species previously contained on the AFGL atmospheric absorption line parameter compilation and on the trace gas compilation.”

Rotational structure in the infrared spectra of carbon dioxide and nitrous oxide dimers – Miller & Watts (1984) “High-resolution infrared predissociation spectra have been measured for dilute mixtures of CO2 and N2O in helium. Rotational fine structure is clearly resolved for both (CO2)2 and (N2O)2, the linewidths being instrument-limited. This establishes that predissociation lifetimes are longer than approximately 50 ns.”

Broadening of Infrared Absorption Lines at Reduced Temperatures: Carbon Dioxide – Tubbs & Williams (1972) “An evacuated high-resolution Czerny-Turner spectrograph, which is described in this paper, has been used to determine the strengths S and self-broadening parameters γ0 for lines in the R branch of the ν3 fundamental of 12C16O2 at 298 and at 207 K. The values of γ0 at 207 K are greater than those to be expected on the basis of a fixed collision cross section σ.”

Investigation of the Absorption of Infrared Radiation by Atmospheric Gases – Burch et al. (1970) “From spectral transmittance curves of very large samples of CO2 we have determined coefficients for intrinsic absorption and pressure-induced absorption from approximately 1130/cm to 1835/cm.”

Absorption of Infrared Radiant Energy by CO2 and H2O. IV. Shapes of Collision-Broadened CO2 Lines – Burch et al. (1969) “The shapes of the extreme wings of self-broadened CO2 lines have been investigated in three spectral regions near 7000, 3800, and 2400 cm−1. … New information has been obtained about the shapes of self-broadened CO2 lines as well as CO2 lines broadened by N2, O2, Ar, He, and H2.”

High-Temperature Spectral Emissivities and Total Intensities of the 15-µ Band System of CO2 – Ludwig et al. (1966) “Spectral-emissivity measurements of the 15-µ band of CO2were made in the temperature range from 1000° to 2300°K.”

Laboratory investigation of the absorption and emission of infrared radiation – Burch & Gryvnak (1966) “Extensive measurements of the absorption by H2O and CO2 have been made in the region from 0·6 to 5·5 microm. Two different multiple-pass absorption cells provided path lengths from 2 to 933 m, and sample pressures were varied from a few μHg to 15 atm. Approximately thirty new CO2 bands were observed and identified, and the strengths of the important bands determined. The H2O data provide enough information for the determination of the strengths and widths of several hundred of the more important lines. The wings of CO2absorption lines were found to be sub-Lorentzian, with the shapes depending on temperature, broadening gas, and wavelength in ways which cannot be explained by present theories. The absorption by H2O and CO2 samples at temperatures up to 1800°K has been studied from 1 to 5 microm. The transmission of radiation from hot CO2 through cold CO2 and from hot H2O through cold H2O has been investigated to determine the effect of the coincidence of emission lines with absorption lines.” Darrell E. Burch, David A. Gryvnak, Journal of Quantitative Spectroscopy and Radiative Transfer, Volume 6, Issue 3, May–June 1966, Pages 229–240, Laboratory investigation of the absorption and emission of infrared radiation - ScienceDirect.

Line shape in the wing beyond the band head of the 4·3 μ band of CO2 – Winters et al.(1964) “Quantitative absorpance measurements have been made in pure CO2 and mixtures of CO2 with N2 and O2 in a 10 m White Perkin-Elmer cell. With absorbing paths up to 50 m-atm, results have been obtained from the band head at 2397 cm−1 to 2575 cm−1.”

Emissivity of Carbon Dioxide at 4.3 µ – Davies (1964) “The emissivity of carbon dioxide has been measured for temperatures from 1500° to 3000°K over the wavelength range from 4.40 to 5.30 µ.”

Absorption Line Broadening in the Infrared – Burch et al. (1962) “The effects of various gases on the absorption bands of nitrous oxide, carbon monoxide, methane, carbon dioxide, and water vapor have been investigated.”

Total Absorptance of Carbon Dioxide in the Infrared – Burch et al. (1962) “Total absorptance… has been determined as a function of absorber concentration w and equivalent pressure Pe for the major infrared absorption bands of carbon dioxide with centers at 3716, 3609, 2350, 1064, and 961 cm−1.”

Rotation-Vibration Spectra of Diatomic and Simple Polyatomic Molecules with Long Absorbing Paths – Herzberg & Herzberg (1953) “The spectrum of CO2 in the photographic infrared has been studied with absorbing paths up to 5500 m. Thirteen absorption bands were found of which eleven have been analyzed in detail.”

The Infrared Absorption Spectrum of Carbon Dioxide – Martin & Barker (1932) “The complete infrared spectrum of CO2 may consistently be explained in terms of a linear symmetrical model, making use of the selection rules developed by Dennison and the resonance interaction introduced by Fermi. The inactive fundamental ν1 appears only in combination bands, but ν2 at 15μ and ν3 at 4.3μ absorb intensely.”

Carbon Dioxide Absorption in the Near Infra-Red – Barker (1922) “Infra-red absorption bands of CO2 at 2.7 and 4.3 μ. – New absorption curves have been obtained, using a special prism-grating double spectrometer of higher resolution (Figs. 1-3). The 2.7 μ region, heretofore considered to be a doublet, proves to be a pair of doublets, with centers at approximately 2.694 μ and 2.767 μ. The 4.3 μ band appears as a single doublet with center at 4.253 μ. The frequency difference between maxima is nearly the same for each of the three doublets, and equal to 4.5 x 10¹¹. Complete resolution of the band series was not effected, even though the slit included only 12 A for the 2.7 μ region, but there is evidently a complicated structure, with a “head” in each case on the side of shorter wave-lengths. The existence of this head for the 4.3 μ band is also indicated by a comparison with the emission spectrum from a bunsen flame, and the difference in wave-length of the maxima of emission and absorption is explained as a temperature effect similar to that observed with other doublets.” [For free full text, click PDF or GIF links in the linked abstract page]

Ueber die Bedeutung des Wasserdampfes und der Kohlensäure bei der Absorption der Erdatmosphäre – Ångström (1900)

Observations on the Absorption and Emission of Aqueous Vapor and Carbon Dioxide in the Infra-Red Spectrum – Rubens & Aschkinass (1898) “Our experiments carried out as described above on the absorption spectrum carbon dioxide very soon showed that we were dealing with a single absorption band whose maximum lies near λ = 14.7 μ. … The whole region of absorption is limited to the interval from 12.5 μ to 16 μ, with the maximum at 14.7 μ.” [For free full text, click PDF or GIF links in the linked abstract page]

On the absorption of dark heat-rays by gases and vapours – Lecher & Pernter (1881)Svante Arrhenius wrote in his famous 1897 paper: “Tyndall held the opinion that the water-vapour has the greatest influence, whilst other authors, for instance Lecher and Pernter, are inclined to think that the carbonic acid plays the more important part.”.

The Bakerian Lecture – On the Absorption and Radiation of Heat by Gases and Vapours, and on the Physical Connexion of Radiation, Absorption, and Conduction – Tyndall (1861) 150 years ago John Tyndall already showed that carbon dioxide absorbs infrared radiation. [Full text] [Wikipedia: John Tyndall]


Closely related

The HITRAN Database – The laboratory work results on the absorption properties of carbon dioxide (and many other molecules) is contained in this database.
 
Same Shit Different Day (SSDD) has been denying the mountains of empirical and theoretical evidence since day 1. When pointed out to the nearly two thousand pages of it to be found in "The Physical Science Basis" by Working Group I of the IPCC, he will first try to tell us there is nothing there because we choose not to spoon feed it to him, then will claim it is not empirical and is all based on flawed models, then will claim all the temperature data is falsified.

He is useless.

What you have proven crick...
....is that you are a lying anti-science moron, SSoooDDumb!


...is that you are unable to differentiate between evidence showing that the climate changes...and evidence showing a cause for the change...you provide evidence of a changing climate and assume that man must be the cause...I have asked for observed, measured, quantified, empirical evidence supporting the AGW hypothesis over natural variability...
....and you have been shown that evidence over and over, but you continue to deny that evidence, like a good little denier cult wacko.


The climate changes and they claim they've eliminated all variables except for a teeny, tiny atmospheric trace element. But ask for one lab experiment and you get the most bizarre and insane reasons why they can't work in a lab
Nope! What you get, CrazyFruitcake, is lists of such experiments.....which you inevitably ignore and then deny that you have ever seen, like a good little brainwashed denier cult wacko.

Papers on laboratory measurements of CO2 absorption properties
Posted by Ari Jokimäki
September 25, 2009

This is a list of papers on laboratory measurements of the absorption properties of carbon dioxide. In the context of these paperlists this is a difficult subject because only few of the papers are freely available online, so we have to settle on abstracts only (of course, interested reader can purchase the full texts for the papers from the linked abstract pages). However, I don’t think that matters that much because the main point of this list really is to show that the basic research on the subject exists. The list is not complete, and will most likely be updated in the future in order to make it more thorough and more representative.

UPDATE (September 23, 2012): Burch & Gryvnak (1966) added.
UPDATE (February 6, 2011): Miller & Watts (1984) added.
UPDATE (July 25, 2010): I modified the introduction paragraph a little to reflect the current content of the list. The old text was a little outdated.
UPDATE (June 22, 2010): Lecher & Pernter (1881) added.
UPDATE (March 31, 2010): Tubbs & Williams (1972), Rubens & Aschkinass (1898) and Ångström (1900) added.
UPDATE (March 6, 2010): Barker (1922) added.
UPDATE (November 19, 2009): Predoi-Cross et al. (2007) added.
UPDATE (September 25, 2009): Miller & Brown (2004) added, thanks to John Cook for bringing it to my attention (see the discussion section below).

Spectroscopic database of CO2 line parameters: 4300–7000 cm−1 – Toth et al. (2008)“A new spectroscopic database for carbon dioxide in the near infrared is presented to support remote sensing of the terrestrial planets (Mars, Venus and the Earth). The compilation contains over 28,500 transitions of 210 bands from 4300 to 7000 cm−1…”

Line shape parameters measurement and computations for self-broadened carbon dioxide transitions in the 30012 ← 00001 and 30013 ← 00001 bands, line mixing, and speed dependence – Predoi-Cross et al. (2007) “Transitions of pure carbon dioxide have been measured using a Fourier transform spectrometer in the 30012 ← 00001 and 30013 ← 00001 vibrational bands. The room temperature spectra, recorded at a resolution of 0.008 cm−1, were analyzed using the Voigt model and a Speed Dependent Voigt line shape model that includes a pressure dependent narrowing parameter. Intensities, self-induced pressure broadening, shifts, and weak line mixing coefficients are determined. The results obtained are consistent with other studies in addition to the theoretically calculated values.” [Full text]

Spectroscopic challenges for high accuracy retrievals of atmospheric CO2 and the Orbiting Carbon Observatory (OCO) experiment – Miller et al. (2005) “The space-based Orbiting Carbon Observatory (OCO) mission will achieve global measurements needed to distinguish spatial and temporal gradients in the CO2 column. Scheduled by NASA to launch in 2008, the instrument will obtain averaged dry air mole fraction (XCO2) with a precision of 1 part per million (0.3%) in order to quantify the variation of CO2 sources and sinks and to improve future climate forecasts. Retrievals of XCO2 from ground-based measurements require even higher precisions to validate the satellite data and link them accurately and without bias to the World Meteorological Organization (WMO) standard for atmospheric CO2 observations. These retrievals will require CO2 spectroscopic parameters with unprecedented accuracy. Here we present the experimental and data analysis methods implemented in laboratory studies in order to achieve this challenging goal.”

Near infrared spectroscopy of carbon dioxide I. 16O12C16O line positions – Miller & Brown (2004) “High-resolution near-infrared (4000–9000 cm-1) spectra of carbon dioxide have been recorded using the McMath–Pierce Fourier transform spectrometer at the Kitt Peak National Solar Observatory. Some 2500 observed positions have been used to determine spectroscopic constants for 53 different vibrational states of the 16O12C16O isotopologue, including eight vibrational states for which laboratory spectra have not previously been reported. … This work reduces CO2 near-infrared line position uncertainties by a factor of 10 or more compared to the 2000 HITRAN line list, which has not been modified since the comprehensive work of Rothman et al. [J. Quant. Spectrosc. Rad. Transfer 48 (1992) 537].”[Full text]

Spectra calculations in central and wing regions of CO2 IR bands between 10 and 20 μm. I: model and laboratory measurements – Niro et al. (2004) “Temperature (200–300 K) and pressure (70–200 atm) dependent laboratory measurements of infrared transmission by CO2–N2 mixtures have been made. From these experiments the absorption coefficient is reconstructed, over a range of several orders of magnitude, between 600 and 1000 cm−1.”

Collisional effects on spectral line-shapes – Boulet (2004) “The growing concern of mankind for the understanding and preserving of its environment has stimulated great interest for the study of planetary atmospheres and, first of all, for that of the Earth. Onboard spectrometers now provide more and more precise information on the transmission and emission of radiation by these atmospheres. Its treatment by ‘retrieval’ technics, in order to extract vertical profiles (pressure, temperature, volume mixing ratios) requires precise modeling of infrared absorption spectra. Within this framework, accounting for the influence of pressure on the absorption shape is crucial. These effects of inter-molecular collisions between the optically active species and the ‘perturbers’ are complex and of various types depending mostly on the density of perturbers. The present paper attempts to review and illustrate, through a few examples, the state of the art in this field.”

On far-wing Raman profiles by CO2 – Benech et al. (2002) “Despite the excellent agreement observed in N2 here, a substantial inconsistency between theory and experiment was found in the wing of the spectrum. Although the influence of other missing processes or neighboring bands cannot be totally excluded, our findings rather suggest that highly anisotropic perturbers, such as CO2, are improperly described when they are handled as point-like molecules, a cornerstone hypothesis in the approach employed.”

Collision-induced scattering in CO2 gas – Teboul et al. (1995) “Carbon-dioxide gas rototranslational scattering has been measured at 294.5 K in the frequency range 10–1000 cm−1 at 23 amagat. The depolarization ratio of scattered intensities in the frequency range 10–1000 cm−1 is recorded. The theoretical and experimental spectra in the frequency range 10–470 cm−1 are compared.”

The HITRAN database: 1986 edition – Rothman et al. (1987) “A description and summary of the latest edition of the AFGL HITRAN molecular absorption parameters database are presented. This new database combines the information for the seven principal atmospheric absorbers and twenty-one additional molecular species previously contained on the AFGL atmospheric absorption line parameter compilation and on the trace gas compilation.”

Rotational structure in the infrared spectra of carbon dioxide and nitrous oxide dimers – Miller & Watts (1984) “High-resolution infrared predissociation spectra have been measured for dilute mixtures of CO2 and N2O in helium. Rotational fine structure is clearly resolved for both (CO2)2 and (N2O)2, the linewidths being instrument-limited. This establishes that predissociation lifetimes are longer than approximately 50 ns.”

Broadening of Infrared Absorption Lines at Reduced Temperatures: Carbon Dioxide – Tubbs & Williams (1972) “An evacuated high-resolution Czerny-Turner spectrograph, which is described in this paper, has been used to determine the strengths S and self-broadening parameters γ0 for lines in the R branch of the ν3 fundamental of 12C16O2 at 298 and at 207 K. The values of γ0 at 207 K are greater than those to be expected on the basis of a fixed collision cross section σ.”

Investigation of the Absorption of Infrared Radiation by Atmospheric Gases – Burch et al. (1970) “From spectral transmittance curves of very large samples of CO2 we have determined coefficients for intrinsic absorption and pressure-induced absorption from approximately 1130/cm to 1835/cm.”

Absorption of Infrared Radiant Energy by CO2 and H2O. IV. Shapes of Collision-Broadened CO2 Lines – Burch et al. (1969) “The shapes of the extreme wings of self-broadened CO2 lines have been investigated in three spectral regions near 7000, 3800, and 2400 cm−1. … New information has been obtained about the shapes of self-broadened CO2 lines as well as CO2 lines broadened by N2, O2, Ar, He, and H2.”

High-Temperature Spectral Emissivities and Total Intensities of the 15-µ Band System of CO2 – Ludwig et al. (1966) “Spectral-emissivity measurements of the 15-µ band of CO2were made in the temperature range from 1000° to 2300°K.”

Laboratory investigation of the absorption and emission of infrared radiation – Burch & Gryvnak (1966) “Extensive measurements of the absorption by H2O and CO2 have been made in the region from 0·6 to 5·5 microm. Two different multiple-pass absorption cells provided path lengths from 2 to 933 m, and sample pressures were varied from a few μHg to 15 atm. Approximately thirty new CO2 bands were observed and identified, and the strengths of the important bands determined. The H2O data provide enough information for the determination of the strengths and widths of several hundred of the more important lines. The wings of CO2absorption lines were found to be sub-Lorentzian, with the shapes depending on temperature, broadening gas, and wavelength in ways which cannot be explained by present theories. The absorption by H2O and CO2 samples at temperatures up to 1800°K has been studied from 1 to 5 microm. The transmission of radiation from hot CO2 through cold CO2 and from hot H2O through cold H2O has been investigated to determine the effect of the coincidence of emission lines with absorption lines.” Darrell E. Burch, David A. Gryvnak, Journal of Quantitative Spectroscopy and Radiative Transfer, Volume 6, Issue 3, May–June 1966, Pages 229–240, Laboratory investigation of the absorption and emission of infrared radiation - ScienceDirect.

Line shape in the wing beyond the band head of the 4·3 μ band of CO2 – Winters et al.(1964) “Quantitative absorpance measurements have been made in pure CO2 and mixtures of CO2 with N2 and O2 in a 10 m White Perkin-Elmer cell. With absorbing paths up to 50 m-atm, results have been obtained from the band head at 2397 cm−1 to 2575 cm−1.”

Emissivity of Carbon Dioxide at 4.3 µ – Davies (1964) “The emissivity of carbon dioxide has been measured for temperatures from 1500° to 3000°K over the wavelength range from 4.40 to 5.30 µ.”

Absorption Line Broadening in the Infrared – Burch et al. (1962) “The effects of various gases on the absorption bands of nitrous oxide, carbon monoxide, methane, carbon dioxide, and water vapor have been investigated.”

Total Absorptance of Carbon Dioxide in the Infrared – Burch et al. (1962) “Total absorptance… has been determined as a function of absorber concentration w and equivalent pressure Pe for the major infrared absorption bands of carbon dioxide with centers at 3716, 3609, 2350, 1064, and 961 cm−1.”

Rotation-Vibration Spectra of Diatomic and Simple Polyatomic Molecules with Long Absorbing Paths – Herzberg & Herzberg (1953) “The spectrum of CO2 in the photographic infrared has been studied with absorbing paths up to 5500 m. Thirteen absorption bands were found of which eleven have been analyzed in detail.”

The Infrared Absorption Spectrum of Carbon Dioxide – Martin & Barker (1932) “The complete infrared spectrum of CO2 may consistently be explained in terms of a linear symmetrical model, making use of the selection rules developed by Dennison and the resonance interaction introduced by Fermi. The inactive fundamental ν1 appears only in combination bands, but ν2 at 15μ and ν3 at 4.3μ absorb intensely.”

Carbon Dioxide Absorption in the Near Infra-Red – Barker (1922) “Infra-red absorption bands of CO2 at 2.7 and 4.3 μ. – New absorption curves have been obtained, using a special prism-grating double spectrometer of higher resolution (Figs. 1-3). The 2.7 μ region, heretofore considered to be a doublet, proves to be a pair of doublets, with centers at approximately 2.694 μ and 2.767 μ. The 4.3 μ band appears as a single doublet with center at 4.253 μ. The frequency difference between maxima is nearly the same for each of the three doublets, and equal to 4.5 x 10¹¹. Complete resolution of the band series was not effected, even though the slit included only 12 A for the 2.7 μ region, but there is evidently a complicated structure, with a “head” in each case on the side of shorter wave-lengths. The existence of this head for the 4.3 μ band is also indicated by a comparison with the emission spectrum from a bunsen flame, and the difference in wave-length of the maxima of emission and absorption is explained as a temperature effect similar to that observed with other doublets.” [For free full text, click PDF or GIF links in the linked abstract page]

Ueber die Bedeutung des Wasserdampfes und der Kohlensäure bei der Absorption der Erdatmosphäre – Ångström (1900)

Observations on the Absorption and Emission of Aqueous Vapor and Carbon Dioxide in the Infra-Red Spectrum – Rubens & Aschkinass (1898) “Our experiments carried out as described above on the absorption spectrum carbon dioxide very soon showed that we were dealing with a single absorption band whose maximum lies near λ = 14.7 μ. … The whole region of absorption is limited to the interval from 12.5 μ to 16 μ, with the maximum at 14.7 μ.” [For free full text, click PDF or GIF links in the linked abstract page]

On the absorption of dark heat-rays by gases and vapours – Lecher & Pernter (1881)Svante Arrhenius wrote in his famous 1897 paper: “Tyndall held the opinion that the water-vapour has the greatest influence, whilst other authors, for instance Lecher and Pernter, are inclined to think that the carbonic acid plays the more important part.”.

The Bakerian Lecture – On the Absorption and Radiation of Heat by Gases and Vapours, and on the Physical Connexion of Radiation, Absorption, and Conduction – Tyndall (1861) 150 years ago John Tyndall already showed that carbon dioxide absorbs infrared radiation. [Full text] [Wikipedia: John Tyndall]


Closely related

The HITRAN Database – The laboratory work results on the absorption properties of carbon dioxide (and many other molecules) is contained in this database.

Thank you for proving my point. Not one of those links was a lab experiment that controlled for CO2
 
Same Shit Different Day (SSDD) has been denying the mountains of empirical and theoretical evidence since day 1. When pointed out to the nearly two thousand pages of it to be found in "The Physical Science Basis" by Working Group I of the IPCC, he will first try to tell us there is nothing there because we choose not to spoon feed it to him, then will claim it is not empirical and is all based on flawed models, then will claim all the temperature data is falsified.

He is useless.

What you have proven crick...
....is that you are a lying anti-science moron, SSoooDDumb!


...is that you are unable to differentiate between evidence showing that the climate changes...and evidence showing a cause for the change...you provide evidence of a changing climate and assume that man must be the cause...I have asked for observed, measured, quantified, empirical evidence supporting the AGW hypothesis over natural variability...
....and you have been shown that evidence over and over, but you continue to deny that evidence, like a good little denier cult wacko.


The climate changes and they claim they've eliminated all variables except for a teeny, tiny atmospheric trace element. But ask for one lab experiment and you get the most bizarre and insane reasons why they can't work in a lab

Nope! What you get, CrazyFruitcake, is lists of such experiments.....which you inevitably ignore and then deny that you have ever seen, like a good little brainwashed denier cult wacko.

Papers on laboratory measurements of CO2 absorption properties
Posted by Ari Jokimäki
September 25, 2009

This is a list of papers on laboratory measurements of the absorption properties of carbon dioxide. In the context of these paperlists this is a difficult subject because only few of the papers are freely available online, so we have to settle on abstracts only (of course, interested reader can purchase the full texts for the papers from the linked abstract pages). However, I don’t think that matters that much because the main point of this list really is to show that the basic research on the subject exists. The list is not complete, and will most likely be updated in the future in order to make it more thorough and more representative.

UPDATE (September 23, 2012): Burch & Gryvnak (1966) added.
UPDATE (February 6, 2011): Miller & Watts (1984) added.
UPDATE (July 25, 2010): I modified the introduction paragraph a little to reflect the current content of the list. The old text was a little outdated.
UPDATE (June 22, 2010): Lecher & Pernter (1881) added.
UPDATE (March 31, 2010): Tubbs & Williams (1972), Rubens & Aschkinass (1898) and Ångström (1900) added.
UPDATE (March 6, 2010): Barker (1922) added.
UPDATE (November 19, 2009): Predoi-Cross et al. (2007) added.
UPDATE (September 25, 2009): Miller & Brown (2004) added, thanks to John Cook for bringing it to my attention (see the discussion section below).

Spectroscopic database of CO2 line parameters: 4300–7000 cm−1 – Toth et al. (2008)“A new spectroscopic database for carbon dioxide in the near infrared is presented to support remote sensing of the terrestrial planets (Mars, Venus and the Earth). The compilation contains over 28,500 transitions of 210 bands from 4300 to 7000 cm−1…”

Line shape parameters measurement and computations for self-broadened carbon dioxide transitions in the 30012 ← 00001 and 30013 ← 00001 bands, line mixing, and speed dependence – Predoi-Cross et al. (2007) “Transitions of pure carbon dioxide have been measured using a Fourier transform spectrometer in the 30012 ← 00001 and 30013 ← 00001 vibrational bands. The room temperature spectra, recorded at a resolution of 0.008 cm−1, were analyzed using the Voigt model and a Speed Dependent Voigt line shape model that includes a pressure dependent narrowing parameter. Intensities, self-induced pressure broadening, shifts, and weak line mixing coefficients are determined. The results obtained are consistent with other studies in addition to the theoretically calculated values.” [Full text]

Spectroscopic challenges for high accuracy retrievals of atmospheric CO2 and the Orbiting Carbon Observatory (OCO) experiment – Miller et al. (2005) “The space-based Orbiting Carbon Observatory (OCO) mission will achieve global measurements needed to distinguish spatial and temporal gradients in the CO2 column. Scheduled by NASA to launch in 2008, the instrument will obtain averaged dry air mole fraction (XCO2) with a precision of 1 part per million (0.3%) in order to quantify the variation of CO2 sources and sinks and to improve future climate forecasts. Retrievals of XCO2 from ground-based measurements require even higher precisions to validate the satellite data and link them accurately and without bias to the World Meteorological Organization (WMO) standard for atmospheric CO2 observations. These retrievals will require CO2 spectroscopic parameters with unprecedented accuracy. Here we present the experimental and data analysis methods implemented in laboratory studies in order to achieve this challenging goal.”

Near infrared spectroscopy of carbon dioxide I. 16O12C16O line positions – Miller & Brown (2004) “High-resolution near-infrared (4000–9000 cm-1) spectra of carbon dioxide have been recorded using the McMath–Pierce Fourier transform spectrometer at the Kitt Peak National Solar Observatory. Some 2500 observed positions have been used to determine spectroscopic constants for 53 different vibrational states of the 16O12C16O isotopologue, including eight vibrational states for which laboratory spectra have not previously been reported. … This work reduces CO2 near-infrared line position uncertainties by a factor of 10 or more compared to the 2000 HITRAN line list, which has not been modified since the comprehensive work of Rothman et al. [J. Quant. Spectrosc. Rad. Transfer 48 (1992) 537].”[Full text]

Spectra calculations in central and wing regions of CO2 IR bands between 10 and 20 μm. I: model and laboratory measurements – Niro et al. (2004) “Temperature (200–300 K) and pressure (70–200 atm) dependent laboratory measurements of infrared transmission by CO2–N2 mixtures have been made. From these experiments the absorption coefficient is reconstructed, over a range of several orders of magnitude, between 600 and 1000 cm−1.”

Collisional effects on spectral line-shapes – Boulet (2004) “The growing concern of mankind for the understanding and preserving of its environment has stimulated great interest for the study of planetary atmospheres and, first of all, for that of the Earth. Onboard spectrometers now provide more and more precise information on the transmission and emission of radiation by these atmospheres. Its treatment by ‘retrieval’ technics, in order to extract vertical profiles (pressure, temperature, volume mixing ratios) requires precise modeling of infrared absorption spectra. Within this framework, accounting for the influence of pressure on the absorption shape is crucial. These effects of inter-molecular collisions between the optically active species and the ‘perturbers’ are complex and of various types depending mostly on the density of perturbers. The present paper attempts to review and illustrate, through a few examples, the state of the art in this field.”

On far-wing Raman profiles by CO2 – Benech et al. (2002) “Despite the excellent agreement observed in N2 here, a substantial inconsistency between theory and experiment was found in the wing of the spectrum. Although the influence of other missing processes or neighboring bands cannot be totally excluded, our findings rather suggest that highly anisotropic perturbers, such as CO2, are improperly described when they are handled as point-like molecules, a cornerstone hypothesis in the approach employed.”

Collision-induced scattering in CO2 gas – Teboul et al. (1995) “Carbon-dioxide gas rototranslational scattering has been measured at 294.5 K in the frequency range 10–1000 cm−1 at 23 amagat. The depolarization ratio of scattered intensities in the frequency range 10–1000 cm−1 is recorded. The theoretical and experimental spectra in the frequency range 10–470 cm−1 are compared.”

The HITRAN database: 1986 edition – Rothman et al. (1987) “A description and summary of the latest edition of the AFGL HITRAN molecular absorption parameters database are presented. This new database combines the information for the seven principal atmospheric absorbers and twenty-one additional molecular species previously contained on the AFGL atmospheric absorption line parameter compilation and on the trace gas compilation.”

Rotational structure in the infrared spectra of carbon dioxide and nitrous oxide dimers – Miller & Watts (1984) “High-resolution infrared predissociation spectra have been measured for dilute mixtures of CO2 and N2O in helium. Rotational fine structure is clearly resolved for both (CO2)2 and (N2O)2, the linewidths being instrument-limited. This establishes that predissociation lifetimes are longer than approximately 50 ns.”

Broadening of Infrared Absorption Lines at Reduced Temperatures: Carbon Dioxide – Tubbs & Williams (1972) “An evacuated high-resolution Czerny-Turner spectrograph, which is described in this paper, has been used to determine the strengths S and self-broadening parameters γ0 for lines in the R branch of the ν3 fundamental of 12C16O2 at 298 and at 207 K. The values of γ0 at 207 K are greater than those to be expected on the basis of a fixed collision cross section σ.”

Investigation of the Absorption of Infrared Radiation by Atmospheric Gases – Burch et al. (1970) “From spectral transmittance curves of very large samples of CO2 we have determined coefficients for intrinsic absorption and pressure-induced absorption from approximately 1130/cm to 1835/cm.”

Absorption of Infrared Radiant Energy by CO2 and H2O. IV. Shapes of Collision-Broadened CO2 Lines – Burch et al. (1969) “The shapes of the extreme wings of self-broadened CO2 lines have been investigated in three spectral regions near 7000, 3800, and 2400 cm−1. … New information has been obtained about the shapes of self-broadened CO2 lines as well as CO2 lines broadened by N2, O2, Ar, He, and H2.”

High-Temperature Spectral Emissivities and Total Intensities of the 15-µ Band System of CO2 – Ludwig et al. (1966) “Spectral-emissivity measurements of the 15-µ band of CO2were made in the temperature range from 1000° to 2300°K.”

Laboratory investigation of the absorption and emission of infrared radiation – Burch & Gryvnak (1966) “Extensive measurements of the absorption by H2O and CO2 have been made in the region from 0·6 to 5·5 microm. Two different multiple-pass absorption cells provided path lengths from 2 to 933 m, and sample pressures were varied from a few μHg to 15 atm. Approximately thirty new CO2 bands were observed and identified, and the strengths of the important bands determined. The H2O data provide enough information for the determination of the strengths and widths of several hundred of the more important lines. The wings of CO2absorption lines were found to be sub-Lorentzian, with the shapes depending on temperature, broadening gas, and wavelength in ways which cannot be explained by present theories. The absorption by H2O and CO2 samples at temperatures up to 1800°K has been studied from 1 to 5 microm. The transmission of radiation from hot CO2 through cold CO2 and from hot H2O through cold H2O has been investigated to determine the effect of the coincidence of emission lines with absorption lines.” Darrell E. Burch, David A. Gryvnak, Journal of Quantitative Spectroscopy and Radiative Transfer, Volume 6, Issue 3, May–June 1966, Pages 229–240, Laboratory investigation of the absorption and emission of infrared radiation - ScienceDirect.

Line shape in the wing beyond the band head of the 4·3 μ band of CO2 – Winters et al.(1964) “Quantitative absorpance measurements have been made in pure CO2 and mixtures of CO2 with N2 and O2 in a 10 m White Perkin-Elmer cell. With absorbing paths up to 50 m-atm, results have been obtained from the band head at 2397 cm−1 to 2575 cm−1.”

Emissivity of Carbon Dioxide at 4.3 µ – Davies (1964) “The emissivity of carbon dioxide has been measured for temperatures from 1500° to 3000°K over the wavelength range from 4.40 to 5.30 µ.”

Absorption Line Broadening in the Infrared – Burch et al. (1962) “The effects of various gases on the absorption bands of nitrous oxide, carbon monoxide, methane, carbon dioxide, and water vapor have been investigated.”

Total Absorptance of Carbon Dioxide in the Infrared – Burch et al. (1962) “Total absorptance… has been determined as a function of absorber concentration w and equivalent pressure Pe for the major infrared absorption bands of carbon dioxide with centers at 3716, 3609, 2350, 1064, and 961 cm−1.”

Rotation-Vibration Spectra of Diatomic and Simple Polyatomic Molecules with Long Absorbing Paths – Herzberg & Herzberg (1953) “The spectrum of CO2 in the photographic infrared has been studied with absorbing paths up to 5500 m. Thirteen absorption bands were found of which eleven have been analyzed in detail.”

The Infrared Absorption Spectrum of Carbon Dioxide – Martin & Barker (1932) “The complete infrared spectrum of CO2 may consistently be explained in terms of a linear symmetrical model, making use of the selection rules developed by Dennison and the resonance interaction introduced by Fermi. The inactive fundamental ν1 appears only in combination bands, but ν2 at 15μ and ν3 at 4.3μ absorb intensely.”

Carbon Dioxide Absorption in the Near Infra-Red – Barker (1922) “Infra-red absorption bands of CO2 at 2.7 and 4.3 μ. – New absorption curves have been obtained, using a special prism-grating double spectrometer of higher resolution (Figs. 1-3). The 2.7 μ region, heretofore considered to be a doublet, proves to be a pair of doublets, with centers at approximately 2.694 μ and 2.767 μ. The 4.3 μ band appears as a single doublet with center at 4.253 μ. The frequency difference between maxima is nearly the same for each of the three doublets, and equal to 4.5 x 10¹¹. Complete resolution of the band series was not effected, even though the slit included only 12 A for the 2.7 μ region, but there is evidently a complicated structure, with a “head” in each case on the side of shorter wave-lengths. The existence of this head for the 4.3 μ band is also indicated by a comparison with the emission spectrum from a bunsen flame, and the difference in wave-length of the maxima of emission and absorption is explained as a temperature effect similar to that observed with other doublets.” [For free full text, click PDF or GIF links in the linked abstract page]

Ueber die Bedeutung des Wasserdampfes und der Kohlensäure bei der Absorption der Erdatmosphäre – Ångström (1900)

Observations on the Absorption and Emission of Aqueous Vapor and Carbon Dioxide in the Infra-Red Spectrum – Rubens & Aschkinass (1898) “Our experiments carried out as described above on the absorption spectrum carbon dioxide very soon showed that we were dealing with a single absorption band whose maximum lies near λ = 14.7 μ. … The whole region of absorption is limited to the interval from 12.5 μ to 16 μ, with the maximum at 14.7 μ.” [For free full text, click PDF or GIF links in the linked abstract page]

On the absorption of dark heat-rays by gases and vapours – Lecher & Pernter (1881)Svante Arrhenius wrote in his famous 1897 paper: “Tyndall held the opinion that the water-vapour has the greatest influence, whilst other authors, for instance Lecher and Pernter, are inclined to think that the carbonic acid plays the more important part.”.

The Bakerian Lecture – On the Absorption and Radiation of Heat by Gases and Vapours, and on the Physical Connexion of Radiation, Absorption, and Conduction – Tyndall (1861) 150 years ago John Tyndall already showed that carbon dioxide absorbs infrared radiation. [Full text] [Wikipedia: John Tyndall]


Closely related

The HITRAN Database – The laboratory work results on the absorption properties of carbon dioxide (and many other molecules) is contained in this database.

Thank you for proving my point. Not one of those links was a lab experiment that controlled for CO2

Nope! I may have proved that you have a pointed head, CrazyFruitcake, and that your posts are pointless garbage, but I never "proved" whatever bullshit bogus point you may have imagined you were making.

ALMOST ALL of those links are to papers on the results of scientific experiments on the properties of carbon dioxide. Your denial of that obvious fact is the same denier cult ideological insanity and self induced blindness that causes you to reject all of the overwhelming evidence supporting the virtually unanimous scientific conclusions on the reality and dangers of human caused global warming and its consequent climate changes.

Just to further demonstrate what a clueless lying denier cult troll you are, here are some easy to spot examples of descriptions of experiments in that list:
...the fourth citation up.....
"Our experiments carried out as described above on the absorption spectrum carbon dioxide very soon showed that we were dealing with a single absorption band...."

...the sixth one up....
"Infra-red absorption bands of CO2 at 2.7 and 4.3 μ. – New absorption curves have been obtained, using a special prism-grating double spectrometer of higher resolution...."

...the eighth one up....
“The spectrum of CO2 in the photographic infrared has been studied with absorbing paths up to 5500 m. Thirteen absorption bands were found of which eleven have been analyzed in detail.”

...the tenth one up....
“The effects of various gases on the absorption bands of nitrous oxide, carbon monoxide, methane, carbon dioxide, and water vapor have been investigated.”

...the twelfth one up....
“Quantitative absorpance measurements have been made in pure CO2 and mixtures of CO2 with N2 and O2 in a 10 m White Perkin-Elmer cell. With absorbing paths up to 50 m-atm, results have been obtained from the band head at 2397 cm−1 to 2575 cm−1.”

...the thirteenth one up....
Laboratory investigation of the absorption and emission of infrared radiation – Burch & Gryvnak (1966)
"Extensive measurements of the absorption by H2O and CO2 have been made in the region from 0·6 to 5·5 microm. Two different multiple-pass absorption cells provided path lengths from 2 to 933 m, and sample pressures were varied from a few μHg to 15 atm. Approximately thirty new CO2 bands were observed and identified, and the strengths of the important bands determined."

...many more....

ZOMG! They used the word "laboratory"!!!

That's amazing!!!

Of course none of them were a lab experiment showing how a 120 ppm change in CO2 can raise temperature or change the climate of a planet but that's besides the point
 
Same Shit Different Day (SSDD) has been denying the mountains of empirical and theoretical evidence since day 1. When pointed out to the nearly two thousand pages of it to be found in "The Physical Science Basis" by Working Group I of the IPCC, he will first try to tell us there is nothing there because we choose not to spoon feed it to him, then will claim it is not empirical and is all based on flawed models, then will claim all the temperature data is falsified.

He is useless.

What you have proven crick...
....is that you are a lying anti-science moron, SSoooDDumb!


...is that you are unable to differentiate between evidence showing that the climate changes...and evidence showing a cause for the change...you provide evidence of a changing climate and assume that man must be the cause...I have asked for observed, measured, quantified, empirical evidence supporting the AGW hypothesis over natural variability...
....and you have been shown that evidence over and over, but you continue to deny that evidence, like a good little denier cult wacko.


The climate changes and they claim they've eliminated all variables except for a teeny, tiny atmospheric trace element. But ask for one lab experiment and you get the most bizarre and insane reasons why they can't work in a lab

Nope! What you get, CrazyFruitcake, is lists of such experiments.....which you inevitably ignore and then deny that you have ever seen, like a good little brainwashed denier cult wacko.

Papers on laboratory measurements of CO2 absorption properties
Posted by Ari Jokimäki
September 25, 2009

This is a list of papers on laboratory measurements of the absorption properties of carbon dioxide. In the context of these paperlists this is a difficult subject because only few of the papers are freely available online, so we have to settle on abstracts only (of course, interested reader can purchase the full texts for the papers from the linked abstract pages). However, I don’t think that matters that much because the main point of this list really is to show that the basic research on the subject exists. The list is not complete, and will most likely be updated in the future in order to make it more thorough and more representative.

UPDATE (September 23, 2012): Burch & Gryvnak (1966) added.
UPDATE (February 6, 2011): Miller & Watts (1984) added.
UPDATE (July 25, 2010): I modified the introduction paragraph a little to reflect the current content of the list. The old text was a little outdated.
UPDATE (June 22, 2010): Lecher & Pernter (1881) added.
UPDATE (March 31, 2010): Tubbs & Williams (1972), Rubens & Aschkinass (1898) and Ångström (1900) added.
UPDATE (March 6, 2010): Barker (1922) added.
UPDATE (November 19, 2009): Predoi-Cross et al. (2007) added.
UPDATE (September 25, 2009): Miller & Brown (2004) added, thanks to John Cook for bringing it to my attention (see the discussion section below).

Spectroscopic database of CO2 line parameters: 4300–7000 cm−1 – Toth et al. (2008)“A new spectroscopic database for carbon dioxide in the near infrared is presented to support remote sensing of the terrestrial planets (Mars, Venus and the Earth). The compilation contains over 28,500 transitions of 210 bands from 4300 to 7000 cm−1…”

Line shape parameters measurement and computations for self-broadened carbon dioxide transitions in the 30012 ← 00001 and 30013 ← 00001 bands, line mixing, and speed dependence – Predoi-Cross et al. (2007) “Transitions of pure carbon dioxide have been measured using a Fourier transform spectrometer in the 30012 ← 00001 and 30013 ← 00001 vibrational bands. The room temperature spectra, recorded at a resolution of 0.008 cm−1, were analyzed using the Voigt model and a Speed Dependent Voigt line shape model that includes a pressure dependent narrowing parameter. Intensities, self-induced pressure broadening, shifts, and weak line mixing coefficients are determined. The results obtained are consistent with other studies in addition to the theoretically calculated values.” [Full text]

Spectroscopic challenges for high accuracy retrievals of atmospheric CO2 and the Orbiting Carbon Observatory (OCO) experiment – Miller et al. (2005) “The space-based Orbiting Carbon Observatory (OCO) mission will achieve global measurements needed to distinguish spatial and temporal gradients in the CO2 column. Scheduled by NASA to launch in 2008, the instrument will obtain averaged dry air mole fraction (XCO2) with a precision of 1 part per million (0.3%) in order to quantify the variation of CO2 sources and sinks and to improve future climate forecasts. Retrievals of XCO2 from ground-based measurements require even higher precisions to validate the satellite data and link them accurately and without bias to the World Meteorological Organization (WMO) standard for atmospheric CO2 observations. These retrievals will require CO2 spectroscopic parameters with unprecedented accuracy. Here we present the experimental and data analysis methods implemented in laboratory studies in order to achieve this challenging goal.”

Near infrared spectroscopy of carbon dioxide I. 16O12C16O line positions – Miller & Brown (2004) “High-resolution near-infrared (4000–9000 cm-1) spectra of carbon dioxide have been recorded using the McMath–Pierce Fourier transform spectrometer at the Kitt Peak National Solar Observatory. Some 2500 observed positions have been used to determine spectroscopic constants for 53 different vibrational states of the 16O12C16O isotopologue, including eight vibrational states for which laboratory spectra have not previously been reported. … This work reduces CO2 near-infrared line position uncertainties by a factor of 10 or more compared to the 2000 HITRAN line list, which has not been modified since the comprehensive work of Rothman et al. [J. Quant. Spectrosc. Rad. Transfer 48 (1992) 537].”[Full text]

Spectra calculations in central and wing regions of CO2 IR bands between 10 and 20 μm. I: model and laboratory measurements – Niro et al. (2004) “Temperature (200–300 K) and pressure (70–200 atm) dependent laboratory measurements of infrared transmission by CO2–N2 mixtures have been made. From these experiments the absorption coefficient is reconstructed, over a range of several orders of magnitude, between 600 and 1000 cm−1.”

Collisional effects on spectral line-shapes – Boulet (2004) “The growing concern of mankind for the understanding and preserving of its environment has stimulated great interest for the study of planetary atmospheres and, first of all, for that of the Earth. Onboard spectrometers now provide more and more precise information on the transmission and emission of radiation by these atmospheres. Its treatment by ‘retrieval’ technics, in order to extract vertical profiles (pressure, temperature, volume mixing ratios) requires precise modeling of infrared absorption spectra. Within this framework, accounting for the influence of pressure on the absorption shape is crucial. These effects of inter-molecular collisions between the optically active species and the ‘perturbers’ are complex and of various types depending mostly on the density of perturbers. The present paper attempts to review and illustrate, through a few examples, the state of the art in this field.”

On far-wing Raman profiles by CO2 – Benech et al. (2002) “Despite the excellent agreement observed in N2 here, a substantial inconsistency between theory and experiment was found in the wing of the spectrum. Although the influence of other missing processes or neighboring bands cannot be totally excluded, our findings rather suggest that highly anisotropic perturbers, such as CO2, are improperly described when they are handled as point-like molecules, a cornerstone hypothesis in the approach employed.”

Collision-induced scattering in CO2 gas – Teboul et al. (1995) “Carbon-dioxide gas rototranslational scattering has been measured at 294.5 K in the frequency range 10–1000 cm−1 at 23 amagat. The depolarization ratio of scattered intensities in the frequency range 10–1000 cm−1 is recorded. The theoretical and experimental spectra in the frequency range 10–470 cm−1 are compared.”

The HITRAN database: 1986 edition – Rothman et al. (1987) “A description and summary of the latest edition of the AFGL HITRAN molecular absorption parameters database are presented. This new database combines the information for the seven principal atmospheric absorbers and twenty-one additional molecular species previously contained on the AFGL atmospheric absorption line parameter compilation and on the trace gas compilation.”

Rotational structure in the infrared spectra of carbon dioxide and nitrous oxide dimers – Miller & Watts (1984) “High-resolution infrared predissociation spectra have been measured for dilute mixtures of CO2 and N2O in helium. Rotational fine structure is clearly resolved for both (CO2)2 and (N2O)2, the linewidths being instrument-limited. This establishes that predissociation lifetimes are longer than approximately 50 ns.”

Broadening of Infrared Absorption Lines at Reduced Temperatures: Carbon Dioxide – Tubbs & Williams (1972) “An evacuated high-resolution Czerny-Turner spectrograph, which is described in this paper, has been used to determine the strengths S and self-broadening parameters γ0 for lines in the R branch of the ν3 fundamental of 12C16O2 at 298 and at 207 K. The values of γ0 at 207 K are greater than those to be expected on the basis of a fixed collision cross section σ.”

Investigation of the Absorption of Infrared Radiation by Atmospheric Gases – Burch et al. (1970) “From spectral transmittance curves of very large samples of CO2 we have determined coefficients for intrinsic absorption and pressure-induced absorption from approximately 1130/cm to 1835/cm.”

Absorption of Infrared Radiant Energy by CO2 and H2O. IV. Shapes of Collision-Broadened CO2 Lines – Burch et al. (1969) “The shapes of the extreme wings of self-broadened CO2 lines have been investigated in three spectral regions near 7000, 3800, and 2400 cm−1. … New information has been obtained about the shapes of self-broadened CO2 lines as well as CO2 lines broadened by N2, O2, Ar, He, and H2.”

High-Temperature Spectral Emissivities and Total Intensities of the 15-µ Band System of CO2 – Ludwig et al. (1966) “Spectral-emissivity measurements of the 15-µ band of CO2were made in the temperature range from 1000° to 2300°K.”

Laboratory investigation of the absorption and emission of infrared radiation – Burch & Gryvnak (1966) “Extensive measurements of the absorption by H2O and CO2 have been made in the region from 0·6 to 5·5 microm. Two different multiple-pass absorption cells provided path lengths from 2 to 933 m, and sample pressures were varied from a few μHg to 15 atm. Approximately thirty new CO2 bands were observed and identified, and the strengths of the important bands determined. The H2O data provide enough information for the determination of the strengths and widths of several hundred of the more important lines. The wings of CO2absorption lines were found to be sub-Lorentzian, with the shapes depending on temperature, broadening gas, and wavelength in ways which cannot be explained by present theories. The absorption by H2O and CO2 samples at temperatures up to 1800°K has been studied from 1 to 5 microm. The transmission of radiation from hot CO2 through cold CO2 and from hot H2O through cold H2O has been investigated to determine the effect of the coincidence of emission lines with absorption lines.” Darrell E. Burch, David A. Gryvnak, Journal of Quantitative Spectroscopy and Radiative Transfer, Volume 6, Issue 3, May–June 1966, Pages 229–240, Laboratory investigation of the absorption and emission of infrared radiation - ScienceDirect.

Line shape in the wing beyond the band head of the 4·3 μ band of CO2 – Winters et al.(1964) “Quantitative absorpance measurements have been made in pure CO2 and mixtures of CO2 with N2 and O2 in a 10 m White Perkin-Elmer cell. With absorbing paths up to 50 m-atm, results have been obtained from the band head at 2397 cm−1 to 2575 cm−1.”

Emissivity of Carbon Dioxide at 4.3 µ – Davies (1964) “The emissivity of carbon dioxide has been measured for temperatures from 1500° to 3000°K over the wavelength range from 4.40 to 5.30 µ.”

Absorption Line Broadening in the Infrared – Burch et al. (1962) “The effects of various gases on the absorption bands of nitrous oxide, carbon monoxide, methane, carbon dioxide, and water vapor have been investigated.”

Total Absorptance of Carbon Dioxide in the Infrared – Burch et al. (1962) “Total absorptance… has been determined as a function of absorber concentration w and equivalent pressure Pe for the major infrared absorption bands of carbon dioxide with centers at 3716, 3609, 2350, 1064, and 961 cm−1.”

Rotation-Vibration Spectra of Diatomic and Simple Polyatomic Molecules with Long Absorbing Paths – Herzberg & Herzberg (1953) “The spectrum of CO2 in the photographic infrared has been studied with absorbing paths up to 5500 m. Thirteen absorption bands were found of which eleven have been analyzed in detail.”

The Infrared Absorption Spectrum of Carbon Dioxide – Martin & Barker (1932) “The complete infrared spectrum of CO2 may consistently be explained in terms of a linear symmetrical model, making use of the selection rules developed by Dennison and the resonance interaction introduced by Fermi. The inactive fundamental ν1 appears only in combination bands, but ν2 at 15μ and ν3 at 4.3μ absorb intensely.”

Carbon Dioxide Absorption in the Near Infra-Red – Barker (1922) “Infra-red absorption bands of CO2 at 2.7 and 4.3 μ. – New absorption curves have been obtained, using a special prism-grating double spectrometer of higher resolution (Figs. 1-3). The 2.7 μ region, heretofore considered to be a doublet, proves to be a pair of doublets, with centers at approximately 2.694 μ and 2.767 μ. The 4.3 μ band appears as a single doublet with center at 4.253 μ. The frequency difference between maxima is nearly the same for each of the three doublets, and equal to 4.5 x 10¹¹. Complete resolution of the band series was not effected, even though the slit included only 12 A for the 2.7 μ region, but there is evidently a complicated structure, with a “head” in each case on the side of shorter wave-lengths. The existence of this head for the 4.3 μ band is also indicated by a comparison with the emission spectrum from a bunsen flame, and the difference in wave-length of the maxima of emission and absorption is explained as a temperature effect similar to that observed with other doublets.” [For free full text, click PDF or GIF links in the linked abstract page]

Ueber die Bedeutung des Wasserdampfes und der Kohlensäure bei der Absorption der Erdatmosphäre – Ångström (1900)

Observations on the Absorption and Emission of Aqueous Vapor and Carbon Dioxide in the Infra-Red Spectrum – Rubens & Aschkinass (1898) “Our experiments carried out as described above on the absorption spectrum carbon dioxide very soon showed that we were dealing with a single absorption band whose maximum lies near λ = 14.7 μ. … The whole region of absorption is limited to the interval from 12.5 μ to 16 μ, with the maximum at 14.7 μ.” [For free full text, click PDF or GIF links in the linked abstract page]

On the absorption of dark heat-rays by gases and vapours – Lecher & Pernter (1881)Svante Arrhenius wrote in his famous 1897 paper: “Tyndall held the opinion that the water-vapour has the greatest influence, whilst other authors, for instance Lecher and Pernter, are inclined to think that the carbonic acid plays the more important part.”.

The Bakerian Lecture – On the Absorption and Radiation of Heat by Gases and Vapours, and on the Physical Connexion of Radiation, Absorption, and Conduction – Tyndall (1861) 150 years ago John Tyndall already showed that carbon dioxide absorbs infrared radiation. [Full text] [Wikipedia: John Tyndall]


Closely related

The HITRAN Database – The laboratory work results on the absorption properties of carbon dioxide (and many other molecules) is contained in this database.

Thank you for proving my point. Not one of those links was a lab experiment that controlled for CO2

Nope! I may have proved that you have a pointed head, CrazyFruitcake, and that your posts are pointless garbage, but I never "proved" whatever bullshit bogus point you may have imagined you were making.

ALMOST ALL of those links are to papers on the results of scientific experiments on the properties of carbon dioxide. Your denial of that obvious fact is the same denier cult ideological insanity and self induced blindness that causes you to reject all of the overwhelming evidence supporting the virtually unanimous scientific conclusions on the reality and dangers of human caused global warming and its consequent climate changes.

Just to further demonstrate what a clueless lying denier cult troll you are, here are some easy to spot examples of descriptions of experiments in that list:
...the fourth citation up.....
"Our experiments carried out as described above on the absorption spectrum carbon dioxide very soon showed that we were dealing with a single absorption band...."

...the sixth one up....
"Infra-red absorption bands of CO2 at 2.7 and 4.3 μ. – New absorption curves have been obtained, using a special prism-grating double spectrometer of higher resolution...."

...the eighth one up....
“The spectrum of CO2 in the photographic infrared has been studied with absorbing paths up to 5500 m. Thirteen absorption bands were found of which eleven have been analyzed in detail.”

...the tenth one up....
“The effects of various gases on the absorption bands of nitrous oxide, carbon monoxide, methane, carbon dioxide, and water vapor have been investigated.”

...the twelfth one up....
“Quantitative absorpance measurements have been made in pure CO2 and mixtures of CO2 with N2 and O2 in a 10 m White Perkin-Elmer cell. With absorbing paths up to 50 m-atm, results have been obtained from the band head at 2397 cm−1 to 2575 cm−1.”

...the thirteenth one up....
Laboratory investigation of the absorption and emission of infrared radiation – Burch & Gryvnak (1966)
"Extensive measurements of the absorption by H2O and CO2 have been made in the region from 0·6 to 5·5 microm. Two different multiple-pass absorption cells provided path lengths from 2 to 933 m, and sample pressures were varied from a few μHg to 15 atm. Approximately thirty new CO2 bands were observed and identified, and the strengths of the important bands determined."

...many more....

ZOMG! They used the word "laboratory"!!! That's amazing!!! Of course none of them were a lab experiment showing how a 120 ppm change in CO2 can raise temperature or change the climate of a planet but that's besides the point

Yup! They used the words: "Laboratory investigation of the absorption and emission of infrared radiation".....and the words: "Extensive measurements of the absorption by H2O and CO2 have been made....". What do you imagine they meant by that, you poor deluded retard?

Actually, in the real world, CrazyFruitcake, almost all of those experiments described in those scientific papers are indeed "showing how a 120 ppm change in CO2 can raise temperature or change the climate of a planet", because they are experiments on the greenhouse gas nature of CO2. You are idiotically denying this fact but that is just because you are far too stupid and ignorant and brainwashed to even begin to understand them....even when their obvious nature is directly pointed out to you.

Like: "Our experiments carried out as described above on the absorption spectrum of carbon dioxide".
Really. Please quit while you're behind. Take a minute, relax. Maybe post next week
 
Really. Please quit while you're behind. Take a minute, relax. Maybe post next week

Translation from ol' CrazyFruitcake's denier cult whining.....
"Please stop kicking my ass to the curb and showing everybody what an empty fraud I am."

Sorry, dipshit, your fraudulent denier cult propaganda meme about supposedly 'no experimental evidence of carbon dioxide's greenhouse gas properties' got completely debunked by just a partial list of such experimental evidence, not to mention the laws of physics. Your anti-science reality-denying insanity is so pathetic.
 
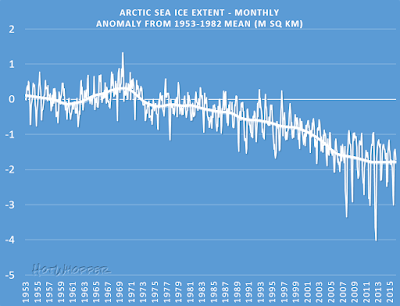
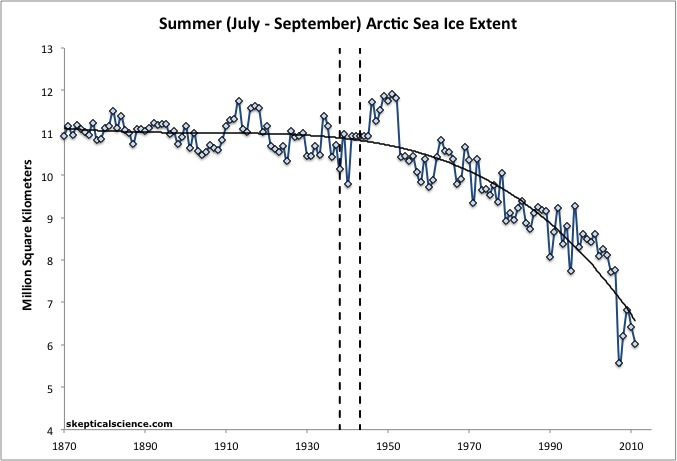
Only if you ignore those inconvenient years that came before 1979, the highest level recorded in decades.... Which means you are repeating a lie matt. A LIE.

Old Rocks already pointed out you were lying-by-cherrypicking. I'll add to that by pointing to the actual data, which demonstrates 1979 was not a high year ... which means you are repeating a lie, Westwall. A LIE.

(I've shown this data to Westwall before, at least twice. He knows he's lying. Anything Westwall says on any topic should initially be assumed to be a lie, unless independent evidence shows otherwise.)

TC - Abstract - A simple approach to providing a more consistent Arctic sea ice extent time series from the 1950s to present

arctic%2Bmo%2Banomaly%2B53-feb16.png


20th-century sea-ice variations from observational data: Ingenta Connect

HistSummerArcticSeaIceExtent.jpg


Arctic sea ice before satellites | National Snow and Ice Data Center

mean_anomaly_1953-2010.png
 

Forum List

Back
Top