Anomalous spike in temperature

Old Rocks

Diamond Member
Oct 31, 2008
63,085
9,749
2,040
Portland, Ore.
http://www.drroyspencer.com/wp-content/uploads/UAH_LT_1979_thru_October_2017_v6-1.jpg

UAH_LT_1979_thru_October_2017_v6-1.jpg

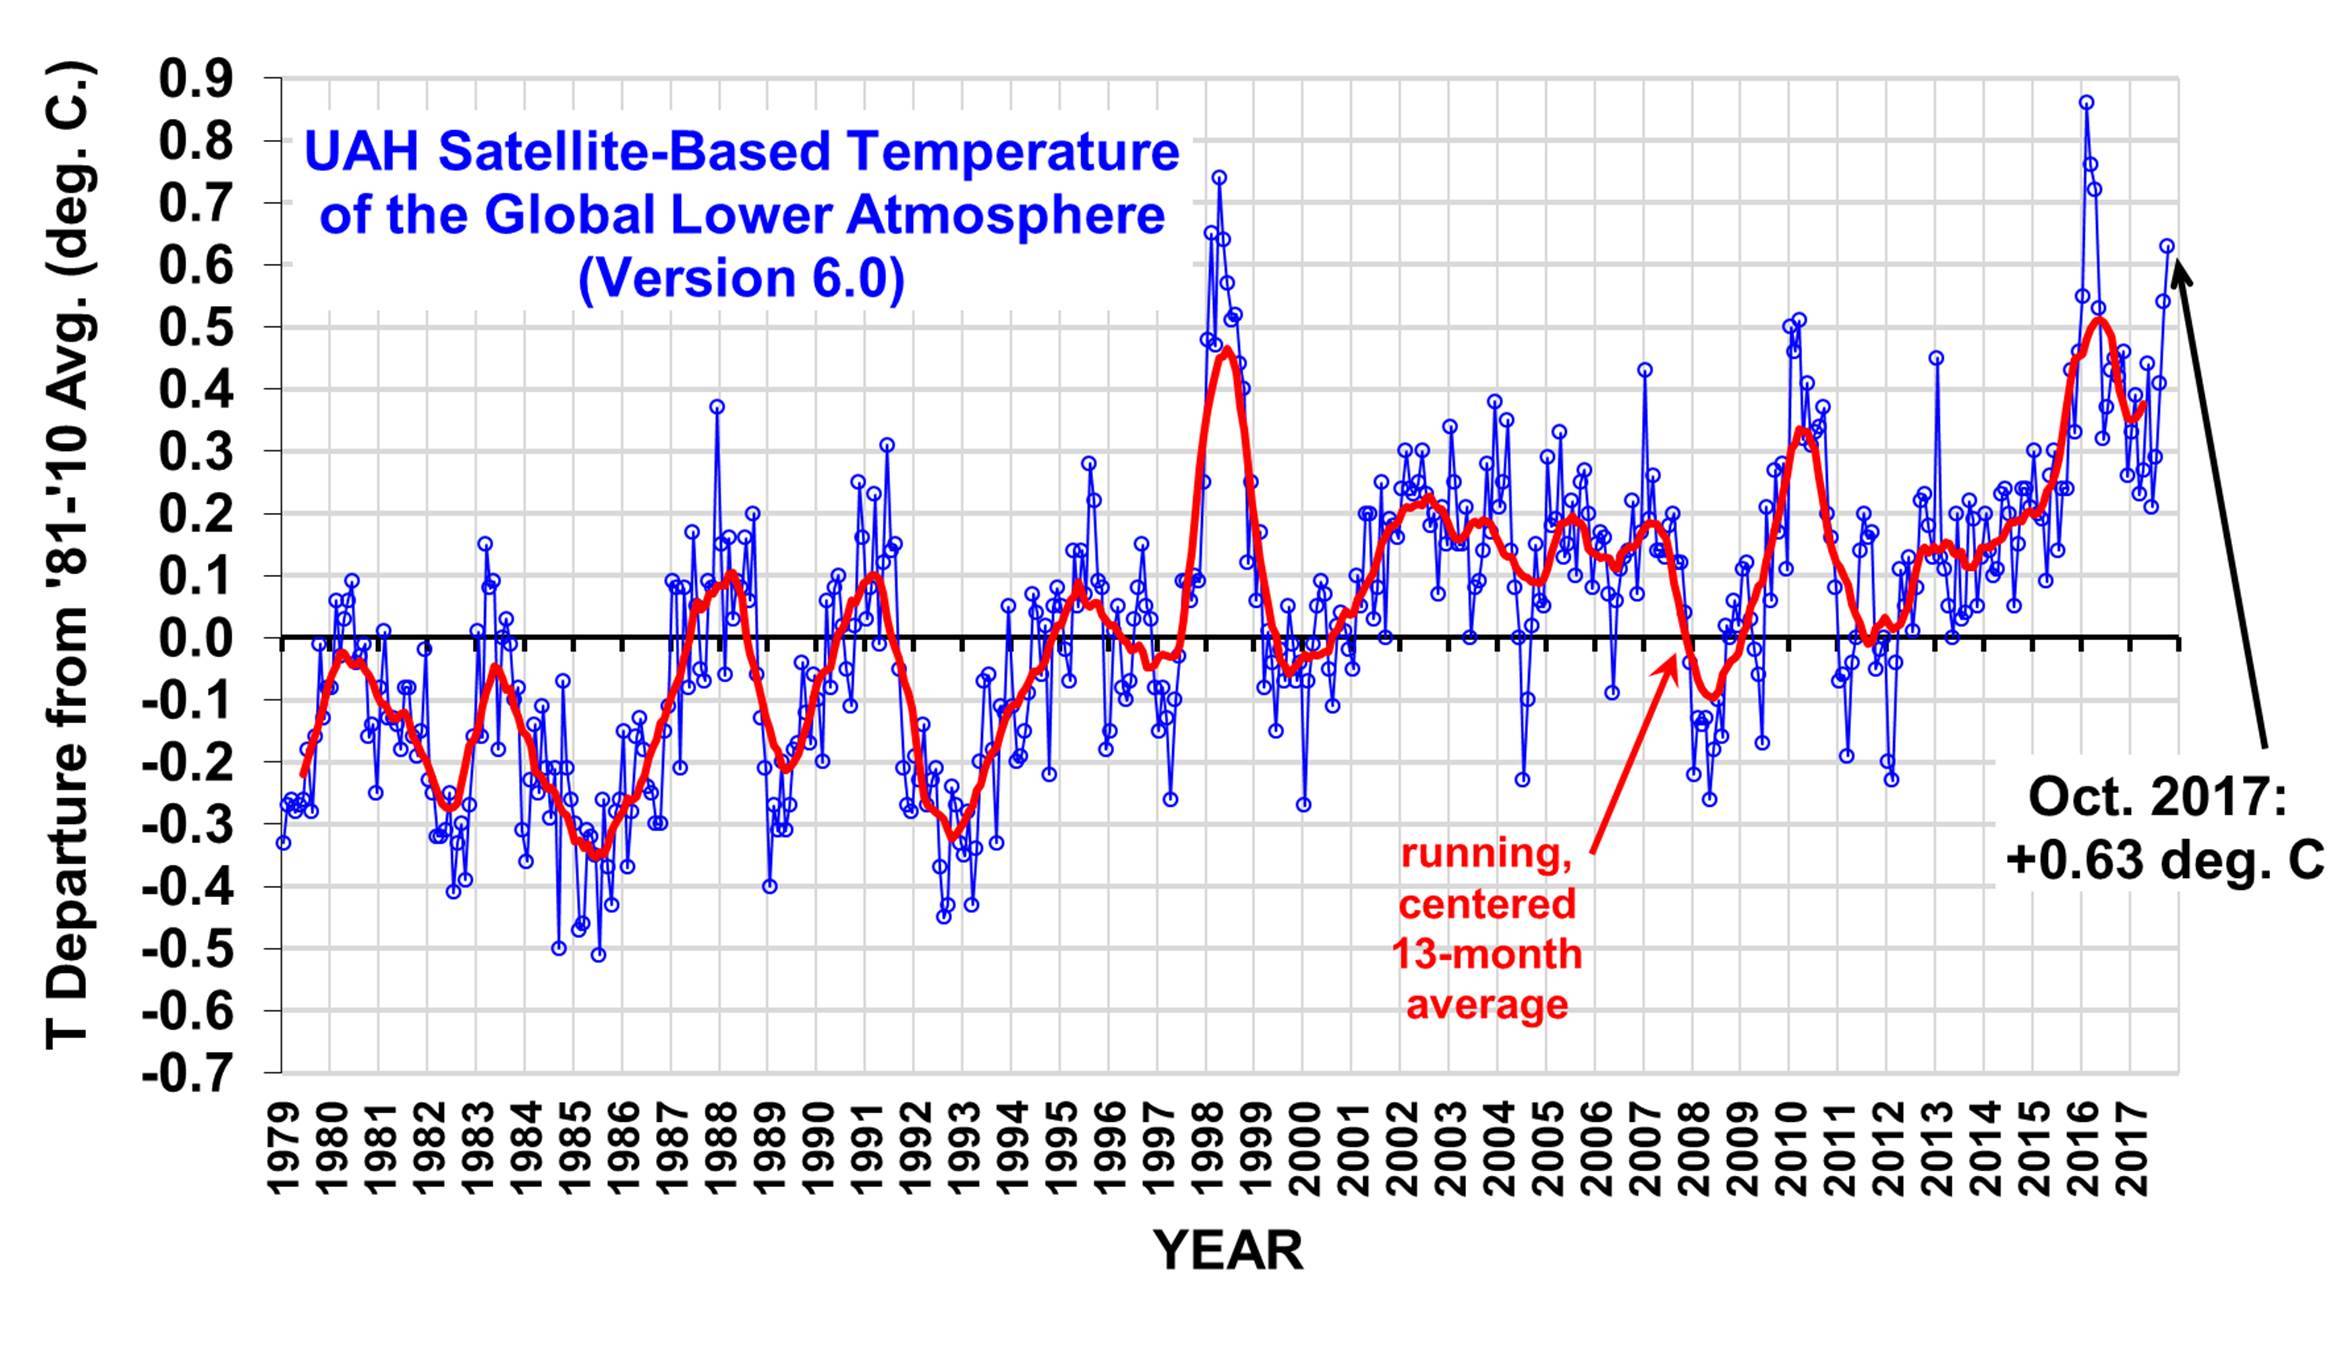
A spike to a temperature anomaly that has been exceeded only six times, all of them in super El Nino's. Yet this is at the beginning of a weak La Nina. I have yet to see any of the science sites with an explanation of what we are seeing.
 
Dunno much about what is happening with the rest of the country, but here in Amarillo TX on Thanksgiving day, it is already 65 degrees, and it is supposed to hit 72 this afternoon.

And this is a week before December...................
 
I concur.

This should be setting off alarm bells for quality control in the satellite data.

If it was in the opposite direction there would be a mad scramble to 'fix' the problem. I hate to be cynical but I doubt that there is the same amount of concern over unexpected warming.
 
The arctic amplification is probably over powering the nina pattern in the tropics.


Is that what the results by region show? Or you just talking out of your ass?


That is the results of the giss data set that covers the area. The arctic warms up in anomaly wise as we move into fall.

I thought we were talking about UAH?

Is the increase across the board, or only in specific regions? If the anomalous readings are specific to only some regions that suggests the readings are OK. If they are everywhere then that suggests that the satellite readings are drifting.
 
And, supposedly -- CO2 has been flat these past three years. What could possibly be driving these massive, unprecedented, planet killing temperature surges?
 
The newly processed data comes from 2015 and 2016, which are important years for climate scientists. These were El Niño years, which are defined by a band of unusually warm water around the equator. This disrupts regular weather patterns, and the 2015 and 2016 El Niño was the most severe in decades.

Under normal circumstances, the concentration of carbon dioxide goes up by two parts per million by volume (ppmv) of air molecules. That works out to four gigatons of added carbon dioxide in the atmosphere. However, the OCO-2 detected a 3 ppmv jump in the recent El Niño years. Climate researchers estimate it’s been around 2,000 years since the Earth has seen such a large increase.


The OCO-2 satellite.

It’s tempting to just chalk this one up to humans burning more fossil fuels, but all the data indicates out activity was unchanged during that period–we certainly didn’t increase our output by 50 percent. The OCO-2 data indicates carbon dioxide sinks like the rainforests were not absorbing as much as they do during other years. In South America, drought slowed plant growth and thus carbon absorption. Warmer weather in Africa accelerated plant decomposition, adding to atmospheric carbon. In Asia, dry conditions and fires also reduced the amount of carbon absorbed by plants.

The team warns that if El Niño frequency increases, so too will greenhouse gas levels. Without carbon sinks working at maximum efficiency, we’ll get ourselves into trouble even faster than predicted. It is hoped that Europe’s upcoming Sentinel-7 carbon dioxide mapping satellites will help scientists study this process in more detail. They could even make it possible to track the carbon output from individual countries to determine who’s doing their part to tackle climate change.

http://elexonic.com/2017/10/16/nasa-satellite-records-big-increase-in-carbon-dioxide/

Go lie somewhere else, Frankie Boy
 
How did October 2017 rank in terms of global temperature
By Brett Anderson, AccuWeather senior meteorologist
11/20/2017, 8:52:44 AM

NASA's Goddard Institute for Space Studies (GISS) just released their global temperature anomaly data for October 2017.

October 2017 temperature anomalies (degrees Celsius) Image courtesy NASA GISS.
590x380_11170104_amapsnew.png


In terms of global land/ocean combined surface temperature anomalies, October 2017 averaged 0.90 of a degree Celcius above the 1951-1980 mean, which makes last month the second warmest October on record going back to 1880.

The warmest October on record still belongs to 2015 with a temperature anomaly of +1.08 degrees Celsius. The third warmest October on record occurred in 2016 (+0.89 of a degree Celsius).

October 2017 ranked as the third warmest October on record for the Northern Hemisphere (+1.02 degrees Celsius).

October 2017 ranked as the second warmest October on record for the Southern Hemisphere (+0.78 of a degree Celsius).

Global temperature anomalies by decade. Undeniable warming trend!
590x286_11170106_screen-shot-2017-11-16-at-7.33.37-pm.png


--------

Based on the current 2017 temperature departure data through October, it looks like 2017 will end up as the second warmest year on record globally coming behind 2016 and just ahead of 2015.

If 2017 ends up as the second warmest year on record, it will be quite remarkable considering most of the year had neutral ENSO conditions before trending toward the cooler La Nina.

How did October 2017 rank in terms of global temperature

Also says very warm October, without an explanation, other than it shouldn't be that warm with an incipient La Nina.
 
Not to worry Goldie Rocks. A new polar orbiting satellite (first in a series of four) was launched last month and is in orbit but undergoing testing and verification procedures... The three satellites used currently for global temperature are aging and we know they are drifting. Even Dr Spencer noted the error bars for his work is now 0.5 deg C +/-. but continue with wild ass assumptions and conjecturing, this is amusing...

NASA and NOAA launch new polar-orbiting weather satellite
 

Forum List

Back
Top