A record-setting blizzard killed 75,000 cows and you might not have even heard about

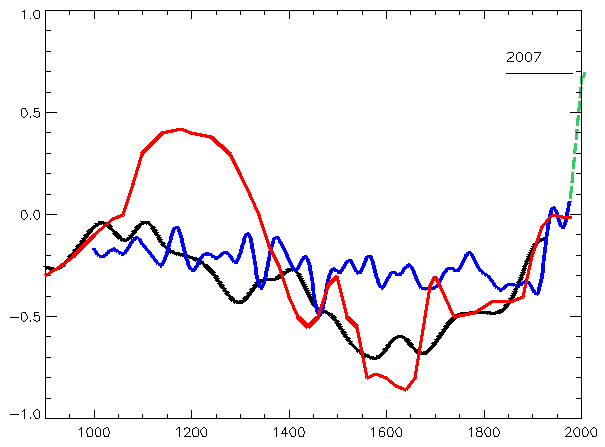
Okay. For argument's sake, I'll give you 0.75C warming during the MWP. Unfortunately for your argument, that warmth rolled on over a period of 500-600 years. Today we have that much added temperature in one-fourth to one-fifth the time. The claim that the rate of warming was equivalent still falls short.

And, as I said, the MWP is irrelevant to any discussion of the current situation.

Proxies can't accurately determine the rate.. If I say it was 100 yrs up and 100 yrs down and 300 yrs in between --- you still have no evidence.. 0.75 in 100 yrs? We don't know --- do we?

Not really irrevelent because we're cleaning out some misconceptions about what we know of weather and climate when man first started to organize on the planet. The facts, (like the Woods Hole study 2009) like I posted above, kinda lay waste to your PRIMARY CLAIMS about AGW temps being unprecendented or warming rates "never been seen before".. Leaves you with a bunch of heavily disputed and (dare I say) REFUTED graphs and studies INTENDED to wipe these facts out of the public discussion..

Basically --- propaganda...
 
The following chart, which was published in the first IPCC report, indicates the MWP was considerably warmer than today:

Er, no. That's a chart of one spot in England. Therefore, it proves ... one spot in northern europe was warmer. Which no one ever disputed.

That graph was dumped within two years, because it was universally realized that research in the area was lacking. So better research was done, and it was clearly seen that the MWP was not global.
 
The following chart, which was published in the first IPCC report, indicates the MWP was considerably warmer than today:

Er, no. That's a chart of one spot in England. Therefore, it proves ... one spot in northern europe was warmer. Which no one ever disputed.

The IPCC published it, not me. You claim it only represents one spot in Northern Europe. Prove it.

That graph was dumped within two years, because it was universally realized that research in the area was lacking. So better research was done, and it was clearly seen that the MWP was not global.

It was dumped because the WMP was embarrassing to their Chicken Little hysteria. That why Michael Mann conjured up his fraudulent Hockey Stick chart, and that's why the IPCC was so eager to dump their previous theory over the side and adopt one that gave them less heartburn. Michael Mann rose to the occasion and committed fraud for the sake of the cult. He is truly a magician above all other magicians.

BTW, when I looked up the WMP on wiki, the article had a pic of one of Michael Mann's Hockey Stick frauds prominently displayed. What more evidence do you need that cultists are dishonest and eager to promote fraud?
 
Last edited:
Please Abraham and Mamooth -- avert your gaze.

Flac, you should take the name "Sergeant Schultz" from now on, given your "I SEE NOTHING!" philosophy.

We get it, already. You're a cherrypicker. What you haven't told us is why anyone should care that you're a cherrypicker.

You were aware that data exists outside of the "CO2 Science" website, right? Or did your masters not tell you about that, leaving your honestly believing that such a website contained all of the data in the world? If that's the case, let me break it to you. Your sources are leaving out most of the data, and only cherrypicking the parts they like, as well as usually distorting it. That fools the rubes, but not the smart people.

Woods Hole Oceanographic is "cherry picking"?? When they say the graphs you and Abe are regurgitating repeatedly are flawed as far as "global" studies?

Didn't like New Zealand or Woods Hole? Name a region sucker...

All this data is good for is ANECDOTAL evidence.. No one in their right mind would try to construct a "global average" out of it ---- UNLESS they were into "cherry picking" and propaganda for AGW..
 
The IPCC published it, not me. You claim it only represents one spot in Northern Europe. Prove it.

If you want me to educate you yet another time, you need to pay first. I only give free education to those willing to learn, which disqualifies you. However, I'm willing to take payment in the form of seeing your source humiliated, as opposed to cash. After all, like most liberals, I value truth over monetary gain.

Hence, you'll need to start by revealing your source for your claim that your graph represents a global temperature. That has to happen first, before we continue.

Then, after I show what you ask, you'll be required to admit that your source lied to you, condemn them as liars, and swear off ever using them again.

Deal?

If you won't make the deal, you've basically admitted you know what I said was correct. So I'm coming out ahead either way.
 
A RECORD-SETTING BLIZZARD KILLED 75,000 COWS AND YOU MIGHT NOT HAVE EVEN HEARD ABOUT IT
Ranchers are still digging out thousands of their cattle that became buried in a record-setting snowstorm in South Dakota late last week and over the weekend.

One would think the death of 75,000 cows by upwards of five feet of snow might get some national attention, but as one blogger observed, it has taken some time for the news of the precipitation massacre to reach outside of local media.

--

Early estimates suggest western South Dakota lost at least 5 percent of its cattle, said Silvia Christen, executive director of the South Dakota Stockgrowers Association. Some individual ranchers reported losses of 20 percent to 50 percent of their livestock, Christen said. The storm killed calves that were due to be sold soon as well as cows that would produce next year’s calves in an area where livestock production is a big part of the economy, she said.

“This is, from an economic standpoint, something we’re going to feel for a couple of years,” Christen said.​

Dang. That's gonna hurt a lot of folks.

Damn. I knew I should have bought two roasts when I was at the store.
 
The IPCC published it, not me. You claim it only represents one spot in Northern Europe. Prove it.

If you want me to educate you yet another time, you need to pay first. I only give free education to those willing to learn, which disqualifies you. However, I'm willing to take payment in the form of seeing your source humiliated, as opposed to cash. After all, like most liberals, I value truth over monetary gain.

Hence, you'll need to start by revealing your source for your claim that your graph represents a global temperature. That has to happen first, before we continue.

Then, after I show what you ask, you'll be required to admit that your source lied to you, condemn them as liars, and swear off ever using them again.

Deal?

If you won't make the deal, you've basically admitted you know what I said was correct. So I'm coming out ahead either way.

In other words, your claims are pure unsubstantiated bullshit.

I never claimed one way or the other that the graph represented a global temperature. I simply noted that the IPCC included it in its report. I doubt the IPCC would publish such a graph in a tome about global warming if it didn't believe it represented global temperatures.
 
A RECORD-SETTING BLIZZARD KILLED 75,000 COWS AND YOU MIGHT NOT HAVE EVEN HEARD ABOUT IT
Ranchers are still digging out thousands of their cattle that became buried in a record-setting snowstorm in South Dakota late last week and over the weekend.

One would think the death of 75,000 cows by upwards of five feet of snow might get some national attention, but as one blogger observed, it has taken some time for the news of the precipitation massacre to reach outside of local media.

--

Early estimates suggest western South Dakota lost at least 5 percent of its cattle, said Silvia Christen, executive director of the South Dakota Stockgrowers Association. Some individual ranchers reported losses of 20 percent to 50 percent of their livestock, Christen said. The storm killed calves that were due to be sold soon as well as cows that would produce next year’s calves in an area where livestock production is a big part of the economy, she said.

“This is, from an economic standpoint, something we’re going to feel for a couple of years,” Christen said.​

Dang. That's gonna hurt a lot of folks.

Damn. I knew I should have bought two roasts when I was at the store.

If you don't mind it "previously frozen" --- might not be pricey at all..
Or at least the pet food prices will go down...

Sadly, my cat has to eat Royal Canin.
 
I doubt the IPCC would publish such a graph in a tome about global warming if it didn't believe it represented global temperatures.

Bri, we've been over this exact topic before. Did you think I'd forget? You challenged me for the data, I provided it, and ... you made no reply. I'm happy to let any subject drop once I've scored an obvious win, so I didn't pursue it. Bringing up the exact same crap that I've already personally debunked for you is pretty sleazy.

http://www.usmessageboard.com/envir...eople-deny-climate-change-52.html#post7866840

Here, let me just redo it all, so you can run from it all again.

bripat9643 said:
Why don't you post a link to the original so we can determine the facts for ourselves?

Description of the Medieval Warm Period and Little Ice Age in IPCC reports - Wikipedia, the free encyclopedia

The original graph from the 1990 IPCC FAR: (This graph was replaced in the 1992 revision)
Ipcc7.1-mann-moberg-manley.png


When the IPCC ?disappeared? the Medieval Warm Period | Watts Up With That?

The altered graph from WUWT: (which lied and claimed the graph was used until 2001)
IPCCMWPopinions.jpg


And from the wiki page (which dates back prior to the 2010 scam graph, so the WUWT scammers can't use ignorance as an excuse)
---
The graph had no clear source (but can be traced to publications by Hubert Lamb representing the Central England Temperature; those publications have no explicit calibration against instrumental data, [and are] just Lamb’s qualitative judgement and interpretation of what he refers to as the ‘evidence’ [1]), and disappeared from the 1992 supplementary report.
---
 
Seems to me -- the IPCC can't be relied upon for a "global" estimate.
Especially not when orgs like Woods Hole don't like their methodologies..

And nobody is relying on just Lamb's work.. Which is far more inclusive than that phoney graph you guys are puking out or the IPCC attempts to purge history..

Gonna name another region? Or can I pick another at random? Maybe South America would please you?
 
I doubt the IPCC would publish such a graph in a tome about global warming if it didn't believe it represented global temperatures.

Bri, we've been over this exact topic before. Did you think I'd forget? You challenged me for the data, I provided it, and ... you made no reply. I'm happy to let any subject drop once I've scored an obvious win, so I didn't pursue it. Bringing up the exact same crap that I've already personally debunked for you is pretty sleazy.

http://www.usmessageboard.com/envir...eople-deny-climate-change-52.html#post7866840

Here, let me just redo it all, so you can run from it all again.

bripat9643 said:
Why don't you post a link to the original so we can determine the facts for ourselves?

Description of the Medieval Warm Period and Little Ice Age in IPCC reports - Wikipedia, the free encyclopedia

The original graph from the 1990 IPCC FAR: (This graph was replaced in the 1992 revision)
Ipcc7.1-mann-moberg-manley.png


When the IPCC ?disappeared? the Medieval Warm Period | Watts Up With That?

The altered graph from WUWT: (which lied and claimed the graph was used until 2001)
IPCCMWPopinions.jpg


And from the wiki page (which dates back prior to the 2010 scam graph, so the WUWT scammers can't use ignorance as an excuse)
---
The graph had no clear source (but can be traced to publications by Hubert Lamb representing the Central England Temperature; those publications have no explicit calibration against instrumental data, [and are] just Lamb’s qualitative judgement and interpretation of what he refers to as the ‘evidence’ [1]), and disappeared from the 1992 supplementary report.
---

The date the Wiki page was created is irrelevant since they are evergreen, meaning they are continually updated to reflect knowledge. According to Wiki, the 1995 report used a chart that only goes back to the year 1400, so it doesn't even show the Medieval Warming Period. However, it's hard to know what it shows since they didn't post that graph. The 1999 report uses Michael Mann's fraudulent Hockey Stick chart.

So I fail to see what you think I've said that you have contradicted. The IPCC started out using a graph that showed a pronounce MWP. When Mann published is fraudulent Hockey Stick, they switched to that.

What part do you disagree with?
 

Forum List

Back
Top