Obama Should Be applauded On The Economy

Some where in the thread was the same old "Reagan fixed the economy by lowering taxes" b.s. And while I agree that lowering taxes likely has the effect of stimulating the economy, so does increased government spending.
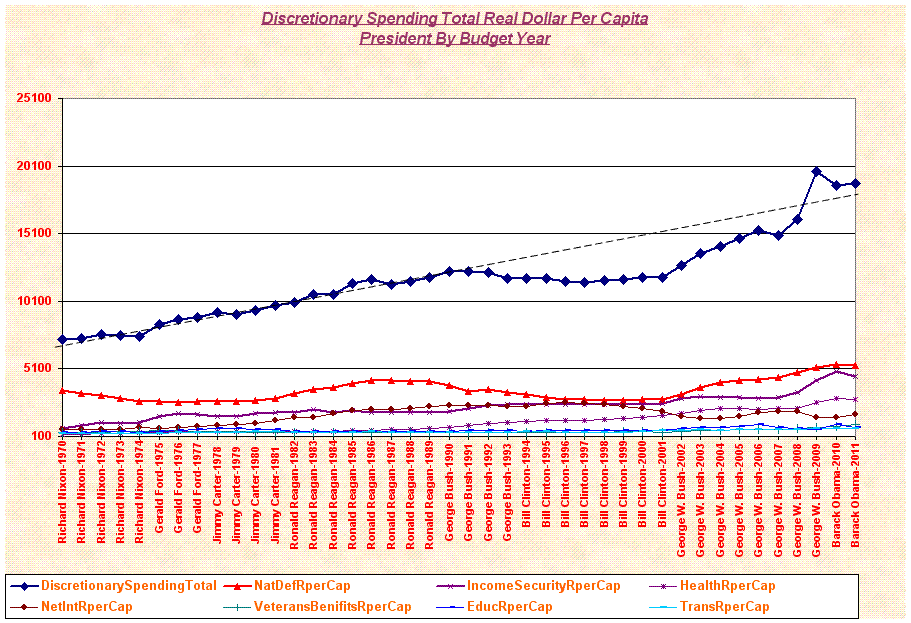
000-00DiscretionarySpendingRealDollarPerCapita-2.gif


And what you will notice here is that the Reagan admin, along with every president except Bush I and Clinton, increased government discretionary spending.

Anyone with any logical sense knows that if you change two factor simultaneously, you cannot claim that one was a causal effect and that the other wasn't.

The thing I find so damn fascinating is that Bush II and Obama have had to return spending back to the trend that existed before Bush I and Clinton cut spending.

The thing is that there are indications that the economy was headed down hill in 2001 and that the Great Recession was simply put off by the housing boom. Whether this was caused by Bush I and Clinton isn't exactly clear, though some MMT guys suggest that the "recession" of 2000-01 was caused by it.

When the gov't continuously lowers taxes and continuously increases spending, it is essentially a continuous Keynesian stimulation by tax and spending multipliers. A single instance of one has an impulse effect that dies off. If the government continues to do it again and again, the impulses overlap and the economy is continuously stimulated.

Problem is, it wasn't working very will since 2001 because both the labor force participation rate and employment continued to decline from that point.
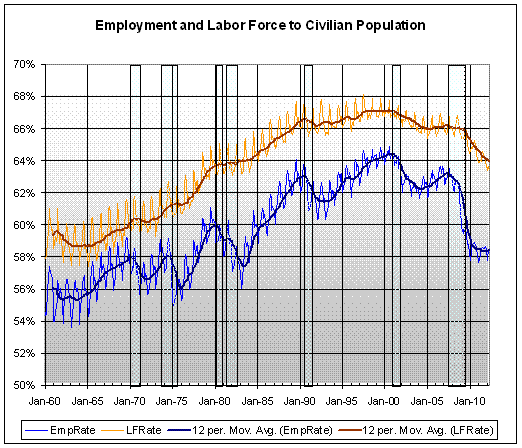
EmpLFRates.gif
 
Some indicators that the whole mess began in 2001

A prevailing MMT theory is that it was the Clinton Era surpluses that caused the recession of 2000 that followed. I forget the exact details and have no idea where I read it, but the basic idea is that surpluses take money out of the economy. I suppose, if accomplished at the wrong time, it will set the economy into a recession. Surely, as fiscal multipliers are a real effect, a surplus policy works no different than a deficit policy, except in the opposite regard.

And the interesting thing is that there are considerable indicators to suggest that the process which finally led to the Dec 2007 recession began in 2001. The Bush/Greenspan era policies worked hard against an underlying process that was set into motion by 2001.

Alternatively, it was little more than the Bush tax cuts of 2001 and accelerated in 2003, along with the increased spending, that drove the funding of the housing market investment bubble. It would be nice to be able to actually track the flow, which we cannot, but the data doesn't differentiate well. It would seem, though, that the GDP was driven by the housing boom. And that housing boom was driven by demand for mortgage backed securities. The combination of lower taxes and increased spending put investment money at the top and spendable income at the bottom. Between the two, the housing market just blossomed.

The following is a set of data sets that show significant changes coincidental with 2001. All dollars are in real terms. Where appropriate and necessary, they are also in per capita terms. Government spending and revenues, for instance, makes no sense unless taken in per capita terms because population continues to grow. Revenues will increase simply on that alone. And while I cannot come up with a sound description of why government spending should remain constant on a per capita basis, it makes a bit of sense. Do we need more military to defend more population? I'm not sure. At the very least, though, it seems less nonsensical that government spending should need to increase per person. So per capita makes sense. Dollars of anything, as a percentage of GDP tends to be as good as real, per capita.

In all cases, things were flat for a long time. Then;

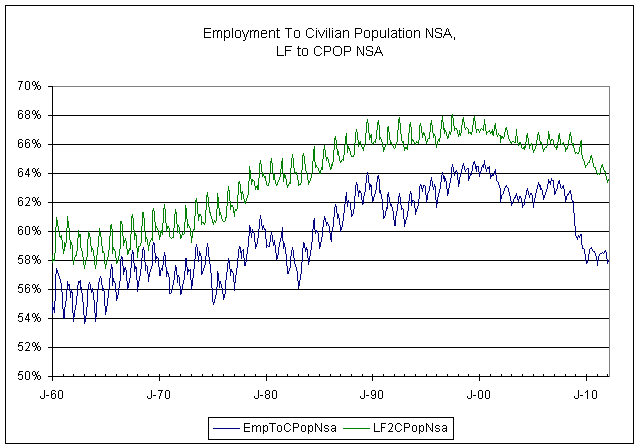
Labor Force and Employment as a percentage of Civilian Population;

EmpLFRates.gif


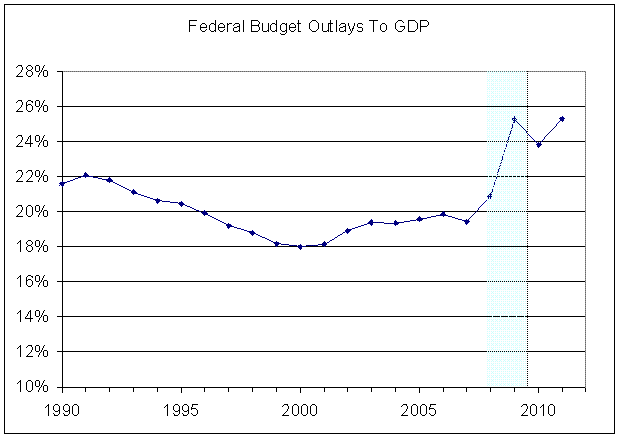
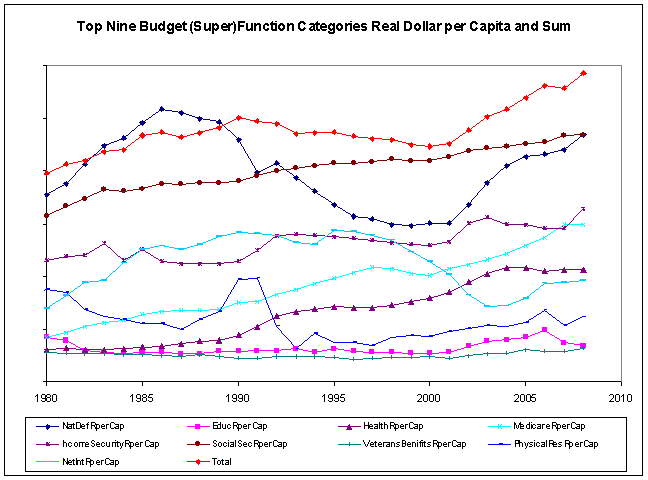
Government outlays began to increase in 2001. (Three views, one with details by gov't function)

000-003FedBudgPerCapReal.gif


FedBudOutlaysToGDP.gif


BudgetSuperFunPerCap.gif


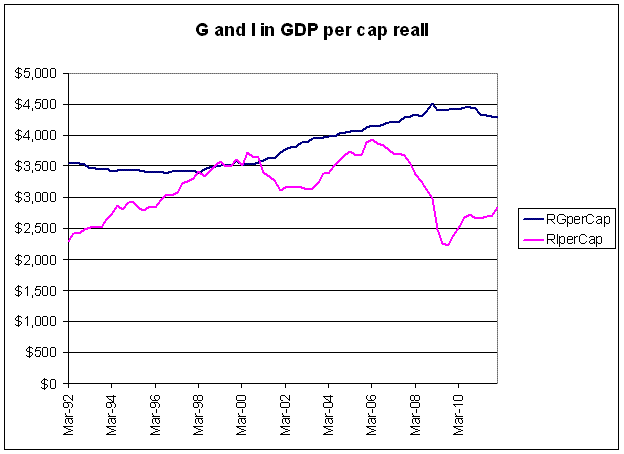
Also, Government part of GDP

G-IinGDPRealCap.gif


The labor force participation rate and employment began it's downward trend in 2001.

000-00EmpToCPOPLFToCPOP-1.gif


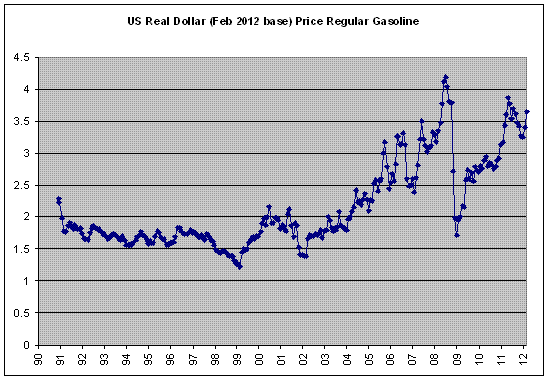
Gasoline prices began to increase in 2001.

GasPricesReal.gif


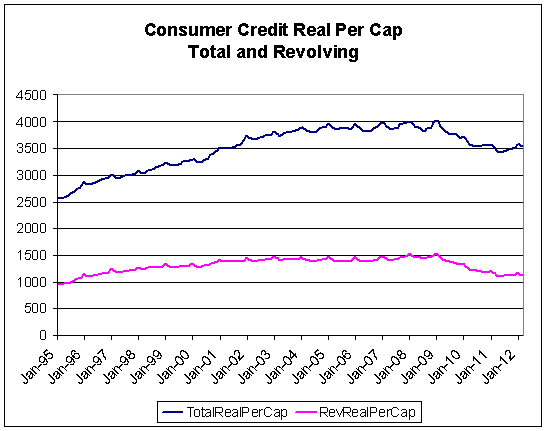
Consumer Credit, Real per Cap

Rate of change becomes important with CC. It is the deceleration in consumer credit accumulation that seems to be important. And, it appears to begin in 2001

CCRealPerCap.gif


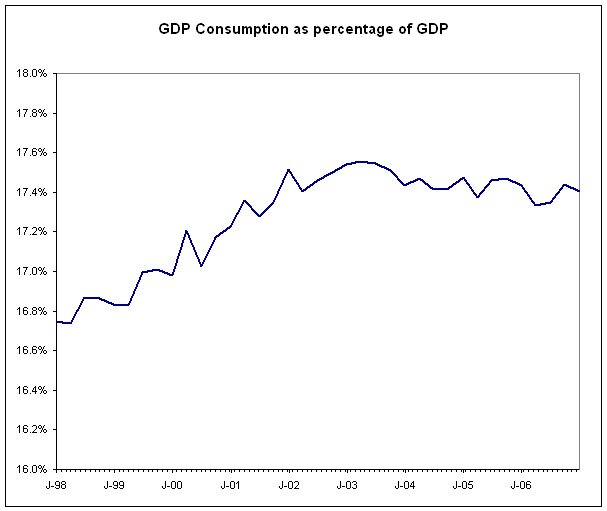
Then 2003 seems to have begun additional changes

Consumption Portion of GDP.

000-001GDPConGDP19982006.gif


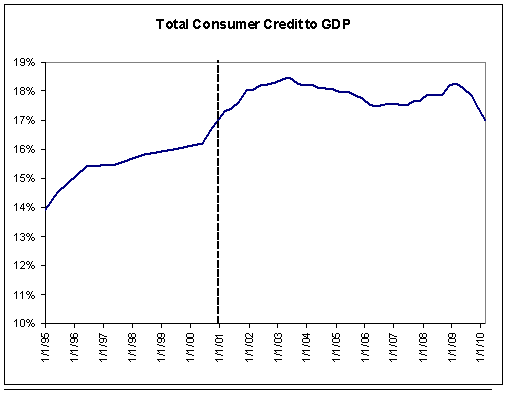
Total Consumer Credit as a percentage of GDP.

TotalCCperGDP.gif


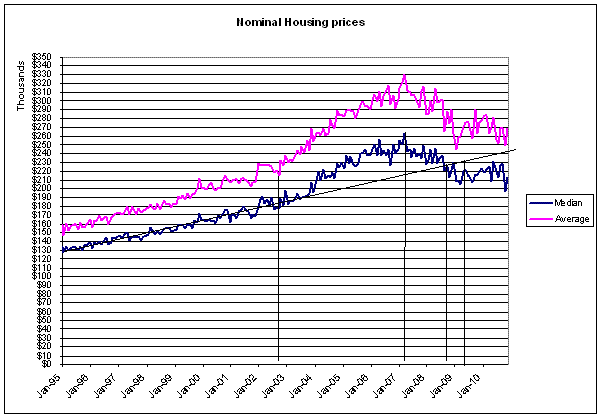
The housing bubble began, for average home price.

HomePrices2000.gif


All in all, it just smacks of a process that began at about 2001, finally crashing in late '07.
 
Be cautious about using LF particitpation and employment-population. In part, they represent changing demographics (age shift so that retirees are a much larger percent of the population) and changing societal trends: increase in percent of 16-24 year olds (or older) in school, and a return to a larger percent of stay home spouses.

I can't say how much of the decline is due to demographics or societal trends versus labor market related issues, though.
 
All in all, it just smacks of a process that began at about 2001, finally crashing in late '07.
it started long before that. It took a turn for the worse in the mid-90s.
 
...it doesn't distort the changes...
Maybe we can just chuck the opinion fuss and fix ourselves on the hard numbers together:

Loss of payroll employment since Obama's inauguration (jobs destroyed):

-552,000


Gain in payroll employment over the same timespan of Reagan's administration (jobs created):

+5,238,000
 
Obama took over the worst economic disaster from Bush in the history since the Great Depression and only had 1 month of double digit unemployment compared to 10 months of double digit unemployment under Reagan. And businesses are making record profits.

Oh good I think I will take your post, print it, and hand it to my sister and her family. They lost almost everything last year because they both lost their jobs. Yes....Obama is great...if you like and believe in politicians and think they solve anything.
 
Be cautious about using LF particitpation and employment-population. In part, they represent changing demographics (age shift so that retirees are a much larger percent of the population) and changing societal trends: increase in percent of 16-24 year olds (or older) in school, and a return to a larger percent of stay home spouses.

I can't say how much of the decline is due to demographics or societal trends versus labor market related issues, though.

You're absolutely right, there are demographic and social changes going on. This is my over riding point. There seem to be some underlying structural (or whatever we can call it) things going on that we are not entirely cognizant of. Simply looking at LF, UE or employment rate alone is terribly deficient. I prefer, though, to start with employment rate.

We cannot use just levels because the population grows. So we have to use rates. As a starting point, what we see is that labor force participation rate and the employment rate have been in decline since 2000.

We have two considerations. Either there has been some structural change going on since 2001, which is bigger then any particular administration/party, or the issue that we have today began as a result of the admin/party in control in the early 2000's. I lean towards the former.

We have seen considerable increases in efficiency which necessarily requires less labor. We have seen an explosion in the housing market that picked up that excess labor. We have seen the structure of the US economy shift continuously towards more service and less manufacturing. And we had this whole thing of massive consumer credit purchasing manufactured imports.

With regard to whatever these changing societal trends are, I've managed to find a few studies.

Trends in labor force participation
http://www.bls.gov/opub/mlr/2006/10/art3full.pdf

U.S. Labor Force Trends 2008
http://www.prb.org/pdf08/63.2uslabor.pdf

Interpreting the Recent Decline in Labor Force Participation
http://www.kc.frb.org/publicat/econrev/pdf/12q1VanZandweghe.pdf

Changing Trends in the Labor Force: A Survey 2008
http://research.stlouisfed.org/publications/review/08/01/DiCecio.pdf

What Explains Trends in Labor Force Participation of Older Men in the United States?
http://ftp.iza.org/dp2991.pdf

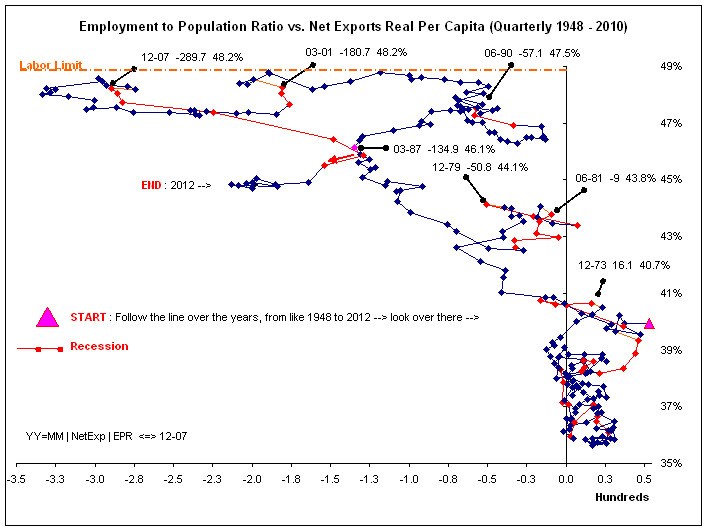
The LF% kept increasing up to about 1998 when it appears to have have hit an upper limit. It bounced on the limit with the recessions.

The effect is more apparent when looking at employment vs net imports.

000-00EmpToPopVNetExpRealPerCap-1.gif


The connecting line follows alone the calendar. I labeled some dates to mark the recessions. The recessions are in red. As you know, net exports (-net imports) go towards zero on recessions. I would suppose that net exports (-net imports) has been a bit of a proxy for consumption. Employment also drops with the recession, obviously. Recovery can be seen by a resurgence of imports so it gives a nice view of things.

Following along from the earliest years, near the bottom right corner, it traces out the history of increasing labor utilization and consumption. What I thought to be notable is how the employment rate hits this upper limit then bounces of it with the most recent recessions. Also, of curiosity, is how each recession does a little loop.

We have seen, since the '60s, considerable change in the workforce.

More recently, we have an increase in the "gestation time" for youths, with schooling moving beyond simply high school and including trade school or college. (it would be nice to see some hard data on that, but I think we can conclude from the wealth of trade schools.) Then we have a whole generation of baby boomers coming into retirement. Your note that there is an increase in stay at home spouses. And then, if you haven't noticed, every decade was an influx of immigrants from one country or another. Iranians when the Shaw was ousted. India sent a wave of engineers. Afghanistan sent another wave in the mid 2000s. Then, of course, our neighbors from Mexico have continued to help us in agriculture.

I don't think we can adequately assess what has been going on without looking at the bigger picture. And, in the bigger picture, the LF% and employment rate began to change direction in 2001. What occurred after 2007, what we see now, is just a continuation of a change that began, or at least should have begun, back in 2001.

My sense is that the economy "should have" shifted more smoothly towards where ever it is going to. Unfortunately, it was easier for the crowd to just follow this unconstrained housing boom and not make the shift. To many people were making a living off of mortgages when, had it not been the easy money, the economy would have shifted. The result is that we missed the mark. But who are we gonna blame for that, the government for enabling it or the markets for doing it?
 
Last edited:
...it doesn't distort the changes...
Maybe we can just chuck the opinion fuss and fix ourselves on the hard numbers together:

Loss of payroll employment since Obama's inauguration (jobs destroyed):

-552,000


Gain in payroll employment over the same timespan of Reagan's administration (jobs created):

+5,238,000

Sure, it is great if you're okay with comparing apples to oranges.
 
Be cautious about using LF particitpation and employment-population. In part, they represent changing demographics (age shift so that retirees are a much larger percent of the population) and changing societal trends: increase in percent of 16-24 year olds (or older) in school, and a return to a larger percent of stay home spouses.

I can't say how much of the decline is due to demographics or societal trends versus labor market related issues, though.

Yeah, I can't say either. Societal trends are driven by labor market related issues. Or better, it is economics that drives societal changes.

Prejudice is often rooted in economics. As the economy expanded and could absorb more labor, then women became a greater part of the workforce.

The major religions were all formed, in a large part, to guide behavior for the purpose of better economic outcomes.

Demographic shifts seem like a bit of interplay, with the economics of the times driving demographic shifts which in turn change that nature of the economics.

Sorry that is all general. It seems to me that the he reason we can't tell if it is demographics or societal trends versus labor market related issues is because they just aren't really distinct.

It strikes me that, up until the early 70's, women were not a greater part of the workforce because the economy simply couldn't absorb that much labor. By the early 70's, the economy was ready for more labor and the barriers to women in the workforce began to fall to the wayside. It wasn't a stark transition as obviously there were plenty of working women prior to that. Waitress was a pretty common female dominated job.

Seems like, at some time in the late 80's, things like paper delivery, which was primarily done by kids, became a job for adults. The lower age bracket has been slowly driven out of the labor force as the economy began picking up more and more of the adult population.

And all the time, efficiency has continued to increase. We continue to need fewer people to supply all existing products and demand. As long as we keep adding more products, it's all great.

What I keep coming back to is the fact that by 2001, we were at 48.8% labor utilization. And it kept bumping up against that. The ratio of civilian non-institutionalized population 16+ to total population is about 75%. 20+ is about 70%. (both have a slight upward trend) I can't say why the labor utilization seems to cap out at about 50%. Is the remaining 20-25% the disabled, elderly, and institutionalized? That may very well be.

Has women entered the workforce displaced the 18-25 age group? This may be. Do we then say that education increasing in post secondary and trade school is the result of society choosing more education or because there was no other choice for high school grads? After all, if they aren't working, they better be doing something cuz' they aren't going to be sitting on their ass playing video games all day, right?

Older workers know that, should they lose their job at 55-60, they may never find work again. The problem is, as much as there isn't suppose to be discrimination against older workers, there is and we know there is.

I also tend to believe that a lot of 65 year olds decided to draw their OASDI, not because they really were ready to retire but because it was the most viable option. I realize that a lot of them went from employment to NILF, skipping unemployment all together, at least that is what it appears in the labor force flows, so I'm not stuck on that idea. But I am not so sure that they didn't do so knowing that they were unlikely to find further work. By the time you hit 65, you kind of sense the way the wind is blowing. You have job hunted enough times that you can tell how the market is.

I am wondering if what we have been seeing, since 2001, has been a compression of the age range for the labor force, with the ends getting lopped off. And, perhaps, a bit of trimming in the mid range, as you note that there are more single income earner families. As competition increases, other options become a more viable choice. Individuals that have to get a job to buy food are going to be far more competitive then individuals who are taking time to do the shopping for themselves and there spouse.

Or, it may very well be that, as the peak of the baby boomers hit retirement, and do retire, there will be all sorts of room for the 20-25 year old crowd and the labor force will shift again.

This is all hypothetical though. The data kind of hints at it. But you now how that goes. Often data will hint at something that just disappears on closer examination. And then something entirely different appears.
 
Obama can ONLY propose.

It takes CONGRESS to dispose.

Congress has done a shyte job on this economy.
 

Forum List

Back
Top