More demand is not the whole answer

When some of you realize that MONEY (hence accouting of debt) is largely artifical, and entirely subject to forces that really do NOT bear any relationship to REALITY, then you'll realize that your fears about the DEBT are rather silly.

You doubt me, of course, because the opposite is what you have been told, and because that is the way the SCAM is played, too.

But do this mind experiment for me....


In 2008, when the entire economy worldwide began collapsing, what prompted that collapse?

Did all the reources go away?

How about all the laborers?

Did the factories fall down?

None of those things happened, yet the economy collapsed.

Why?

You have not done a reasonable job if explaining your position vis-a-vis money and debt, I see no logic in it. Perhaps you would lay it out in more detail.

Have you read or heard of a book by Reinhart and Rogoff called "This Time Is Different"? It basically says that over the past 800 years, research shows that economies that go into debt above a certain point experience a reduction in economic growth and go into full or partial default. ALWAYS.
 
Last edited:
For a business, what's the one thing you NEVER borrow for? Ever!

To meet payroll. If you're borrowing to meet that, you're sunk already.
 
Inexpertly, inflation-adjusted real wages per worker (W/P/N) fell in the 1970s, coinciding with the OPEC oil embargoes; recovered by the 1990s; and are still rising (more slowly) since 2000
The US Census tracks household income. That did start to fall in 2000 http://www.census.gov/hhes/www/income/data/historical/household/2010/H01AR_2010.xls
So, since 2000, real income per household has stabilized (or even slumped slightly...
Numbers for wages are misleading because they're just a part of income, and that link was for the range top incomes, not household incomes for the range.

By multiplying the Census %'s times the BEA's total income we get household incomes hitting all time highs in 2008 and falling since the '09 'recovery'.

Quintile Household Income 2005$
Year lowest__4th_____middle__2nd______highest
2000 $15,852 $39,191 $65,171 $101,279 $219,292
2001 $15,540 $38,627 $64,823 $102,118 $222,440
2002 $15,358 $38,614 $64,942 $102,239 $218,081
2003 $15,038 $38,479 $65,459 $103,495 $220,259
2004 $15,346 $39,268 $66,350 $104,715 $226,131
2005 $15,584 $39,420 $66,921 $105,424 $231,017
2006 $16,074 $40,658 $68,552 $108,264 $238,749
2007 $16,437 $42,059 $71,548 $113,123 $240,266
2008 $16,592 $41,969 $71,738 $113,707 $244,006
2009 $15,849 $40,015 $67,747 $107,631 $233,663
2010 $15,356 $39,789 $68,511 $109,816 $235,687
2011 $14,962 $39,788 $69,675 $112,677 $239,067
All but the lowest are still up and the average is 8% higher than 2000.
 
as i stated in another thread, i perceive you are confusing "aggregate household income" (from the Census Bureau) with (say) "aggregate personal income" (from the BEA). The data straight from the CB, for real incomes per household, show stagnation after 2000:
realtopincomesperhouseh.png
But, real wages per worker have only increased. Evidently, the average number of workers per legal, official, "household", are declining. Individually, workers are earning more than ever. Grouped together in "households", more & more of which are single people, or single-income families, average income per "household family unit" has stalled out, since 2000.

Do businesses hire workers, or "family household units"? Businesses are only responsible for the wages they pay their workers, and those are higher than ever. How people date, marry, and live together after hours, is non-relevant. Income per "legal household accounting unit" seems bogus. Businesses hire workers; businesses are paying higher real wages than ever; who exactly is complaining?

Yes, it seems individual incomes have continued to rise while household incomes have flattened , even fallen slightly. This is consistent with the decline in the labor force and employment to population ratio (BLS CPS data set).

If more and more households were single income earners, then it would follow the same trend as individual incomes.

It seems also consistent with the idea of more single income earner households.

It isn't consistent with more PhD/MS dual income households. Especially if upper income earners are consistently earning more real income.

Of course, the best way to be sure is if we had comparable data sets with individual incomes broken out similarly as the household data along with demographic data on households themselves.

I'm not sure what your point is that businesses higher workers, not households. We are discussing economics and economics is the study of the distribution of scarce resources. It includes both businesses, households, individuals, and government. Demographic and socio-economic changes. If the demographics and socio-economcs have changed, it changes the distribution of those scarce resources.

The fact that the employment to population ratio, as well as the labor force participation rate has fallen, since 2000, suggests a trend of "under-utilization" of labor which suggests even scarcer resources to distribute.
 
Numbers for wages are misleading because they're just a part of income, and that link was for the range top incomes, not household incomes for the range.

Quitiles are a standard method for presenting the distribution of data. It does present what the household incomes are for that range. For the second 20% of households, the range is between the top of the lower 20% and the top of the second 20%.

By multiplying the Census %'s times the BEA's total income we get household incomes hitting all time highs in 2008 and falling since the '09 'recovery'.

Quintile Household Income 2005$
Year lowest__4th_____middle__2nd______highest
2000 $15,852 $39,191 $65,171 $101,279 $219,292
2001 $15,540 $38,627 $64,823 $102,118 $222,440
2002 $15,358 $38,614 $64,942 $102,239 $218,081
2003 $15,038 $38,479 $65,459 $103,495 $220,259
2004 $15,346 $39,268 $66,350 $104,715 $226,131
2005 $15,584 $39,420 $66,921 $105,424 $231,017
2006 $16,074 $40,658 $68,552 $108,264 $238,749
2007 $16,437 $42,059 $71,548 $113,123 $240,266
2008 $16,592 $41,969 $71,738 $113,707 $244,006
2009 $15,849 $40,015 $67,747 $107,631 $233,663
2010 $15,356 $39,789 $68,511 $109,816 $235,687
2011 $14,962 $39,788 $69,675 $112,677 $239,067
All but the lowest are still up and the average is 8% higher than 2000.

I'm not sure what your doing there. Are you multiplying $ times $?
 
(something doesn't jive)

First, i obtained the number of "households" (from the CB); and the number of workers & people (from FRED). Since the 1960s, the number of persons per household has decreased from 3 to 2; the number of workers per household has remained constant, at about 1.
workersandpeopleperhous.png
Second, i further obtained the real aggregate "Personal Income" (PI) and "Disposable Personal Income" (DPI = PI - taxes); as well as those former figures, less welfare (PI - welfare, DPI - welfare). All of those measures of "income" per household have increased, in real terms, steadily, since the 1960s:
personalincomesperhouse.png
Nationally-accounted aggregate incomes have grown faster than the population; and faster even than the number of households; even in real (inflation-adjusted) terms. Nationally-accounted real incomes per household are higher than ever (except for 2008). The CB figures evidently represent some other statistics.
 
Not many companies will increase supply without some indication that they can expect more demand.

you miss the whole point, supply creates its own demand. When, after 5 million years someone invented the plow there was instant demand, when jobs invented the iphone there was instant demand. Supply makes and economy grow. Now you too understand economics.

I see your point. Good businesses are born from unmet/unknown needs OR wants. If there is truly VALUE in supplying those needs or wants a new market will surely follow. A problem with government is we have a *(&^%load of ideas generated by the ^%*&%load of taxroll employees and elected officials, and THEY do not follow the business rule of thumb that requires that the idea must have true value in order to warrant existence. They simply decide, "we have this &*^(*%^load of tax dollars...let's spend it, otay? This has been fun.
 
(something doesn't jive)

First, i obtained the number of "households" (from the CB); and the number of workers & people (from FRED). Since the 1960s, the number of persons per household has decreased from 3 to 2; the number of workers per household has remained constant, at about 1.
workersandpeopleperhous.png
Second, i further obtained the real aggregate "Personal Income" (PI) and "Disposable Personal Income" (DPI = PI - taxes); as well as those former figures, less welfare (PI - welfare, DPI - welfare). All of those measures of "income" per household have increased, in real terms, steadily, since the 1960s:
personalincomesperhouse.png
Nationally-accounted aggregate incomes have grown faster than the population; and faster even than the number of households; even in real (inflation-adjusted) terms. Nationally-accounted real incomes per household are higher than ever (except for 2008). The CB figures evidently represent some other statistics.

Not necessarily. One presents a distribution, the other a single average.

There is a reason for there being three "averages", mean, median and mode. They shift relative position depending on the skew of the data.

For home prices, the median is typically used because housing prices tend to be skewed and the mean overstates the "typical" selling price of houses in the area. Far fewer houses are priced at the higher end of the range but those prices pull the average up, thus overstating the typical house price.

What we see with the distribution of incomes is that they have become more skewed. This can have the effect of "pulling" the average upward.

My preference would be that the IRS should present income levels and ranges with more resolution. Then we would be able to better see how income is distributed. We don't know if it's more like a normal distribution, Poisson distribution, or what.

We do know something, given the CB quintile data and the average given the Fed data. It suggests that the income distribution has become more skewed to the right.
\
 
Last edited:
(something doesn't jive)

First, i obtained the number of "households" (from the CB); and the number of workers & people (from FRED). Since the 1960s, the number of persons per household has decreased from 3 to 2; the number of workers per household has remained constant, at about 1.
workersandpeopleperhous.png
Second, i further obtained the real aggregate "Personal Income" (PI) and "Disposable Personal Income" (DPI = PI - taxes); as well as those former figures, less welfare (PI - welfare, DPI - welfare). All of those measures of "income" per household have increased, in real terms, steadily, since the 1960s:
personalincomesperhouse.png
Nationally-accounted aggregate incomes have grown faster than the population; and faster even than the number of households; even in real (inflation-adjusted) terms. Nationally-accounted real incomes per household are higher than ever (except for 2008). The CB figures evidently represent some other statistics.

That workers per household and persons per household is interesting. Again, things changed direction in about 2000.

The workers per household hasn't remained constant. It has gone from near 1.1 to near 1.25 at it's peak.

That is (1.25-1.1)/1.1 = 13.6% change. A 13.6% change may very well be significant. A 5% change in unemployment is considered heck of significant.
 
Total "household income" (HI) accounted by the CB, is not the same statistic, as total "personal income" (PI) accounted by the BEA. The following figure plots:
  • PI
  • PI - welfare
  • HI
From the figure, HI does not include welfare; and does not include some other source of income, accounted into PI. PI is the sum of wages & salaries (labor), rents (land), interest & dividends (loans). HI excludes capital gains:
The Census Bureau collects income data on several major surveys, including the Annual Social and Economic Supplement (ASEC) of the Current Population Survey (CPS)... The CPS [is] the most widely cited source of annual household income estimates for the United States. The CPS measure of money income is defined as the total pre-tax cash income received by people on a regular basis, excluding certain lump-sum payments and excluding capital gains.
Mathematically, some definition denies "income" to households, depressing that statistic, relative to all others (even direct wages per worker). Overall, there are a slew of indicators (GDP per capita, wages per worker, income per household). Most are surging; the most depressed has stalled out, but still at or near the highest levels ever. There seems little grounds for complaining on this issue:
householdincomevspi.png
Adding (net) welfare receipts, to HI, yields the following figure. HI + welfare has continued increasing, even after 2000, when HI stabilized:
hipiwelfare.png


http://en.wikipedia.org/wiki/Personal_income_in_the_United_States
 
Last edited:
When some of you realize that MONEY (hence accouting of debt) is largely artifical, and entirely subject to forces that really do NOT bear any relationship to REALITY, then you'll realize that your fears about the DEBT are rather silly.

You doubt me, of course, because the opposite is what you have been told, and because that is the way the SCAM is played, too.

But do this mind experiment for me....


In 2008, when the entire economy worldwide began collapsing, what prompted that collapse?

Did all the reources go away?

How about all the laborers?

Did the factories fall down?

None of those things happened, yet the economy collapsed.

Why?

You have not done a reasonable job if explaining your position vis-a-vis money and debt, I see no logic in it. Perhaps you would lay it out in more detail.

Have you read or heard of a book by Reinhart and Rogoff called "This Time Is Different"? It basically says that over the past 800 years, research shows that economies that go into debt above a certain point experience a reduction in economic growth and go into full or partial default. ALWAYS.


Oh I don't doubt that this sham includes a nation or government going insolvent.

What I am telling you is the debt is a SHAM in the first place.

Where did the money come from in the first place that we "borrowed"?

It was manufactured out of thin air by the BANSTERS.

Once again, I ask you to explain how can a fuctioning society that does not suffer some REAL DISASTER (onethat destroys the means of production) go from functional to NOT functional in ONE DAY?

Please explain that to us, okay? Where did the WEALTH go that existed the day BEFORE the meltdown?

Show us you understand why this nation is currently in a recession.

Do it in detail.
 
" What I am telling you is the debt is a SHAM in the first place. "


Sham? As in not real? You realize that the gov'ts debt is owed to somebody right? We pay interest on it, currently about $250 billion but that's going to steadily increase as the debt gets larger and the interest rates go up. How do you feel about paying a trillion bucks a year just in interest payments? And they will you know, may take awhile but they will go up, eating a bigger and bigger chunk of our budget every year. I don't understand how you can ignore it.


" Where did the money come from in the first place that we "borrowed"?

It was manufactured out of thin air by the BANSTERS. "


What difference does it make whether it's electronic or real money or gold? A debt is a debt that must be serviced and paid eventually. The Fed can print more money, but the bankers don't. They don't manufacture money out of thin air, people, investors, companies, and corporations do that. They buy, they sell, and wealth is created in a bank. The banksters just facilitate the transactions and keep track of who owns what.


Once again, I ask you to explain how can a functioning society that does not suffer some REAL DISASTER (onethat destroys the means of production) go from functional to NOT functional in ONE DAY?


Where do you get the idea that a society goes from functional to not functional in one day? That's ridiculous, nobody ever said that except you. We take a hit, sometimes a big hit, in society's GDP and overall total worth, but we'll always be functional as long as the gov't and banking system are operational.


Please explain that to us, okay? Where did the WEALTH go that existed the day BEFORE the meltdown?


Much of the wealth in this country is electronic, housing values and IRA/401k plans declined in value as the market dropped, no big mystery. The wealth that existed before the meltdown was reduced because muchof it was overvalued. Seriously overvalued, so much so that the length and depth of the recession was quite severe.


Show us you understand why this nation is currently in a recession.

Do it in detail.


First of all, I didn't say this nation is in a recession; I do think we're getting close to another one though, what with the rest of the world slowing down economically and the unrest in the middle east. The officlal definition of a recession is a contraction of economic growth as measured in GDP. We're muddling along at around 2% growth, that's pretty flimsy. Doesn't take much of a jolt to drop into negative territory. You know about taxmageddon, right? That'd do it I think.
 
Last edited:
Where did the money come from in the first place that we "borrowed"?

It was manufactured out of thin air by the BANSTERS.

that is too stupid!!! if it was from thin air they would manufacture billions for themselves and retire!!

in reality money is very precious to banks. If they make bad loans they don't merely manufacture more money out of thin air as you stupidly say, instead, they go bankrupt!!

the system works that way so people's scarce resources are invested only where they have the best likelihood of being profitable or where the inputs are less than the outputs.

Now even you know how we make economic progress.
Jesus, that is scary. Thinking that someone would learn something would indicate that they are getting dumber.
 
Total "household income" (HI) accounted by the CB, is not the same statistic, as total "personal income" (PI) accounted by the BEA. The following figure plots:
  • PI
  • PI - welfare
  • HI
From the figure, HI does not include welfare; and does not include some other source of income, accounted into PI. PI is the sum of wages & salaries (labor), rents (land), interest & dividends (loans). HI excludes capital gains:
The Census Bureau collects income data on several major surveys, including the Annual Social and Economic Supplement (ASEC) of the Current Population Survey (CPS)... The CPS [is] the most widely cited source of annual household income estimates for the United States. The CPS measure of money income is defined as the total pre-tax cash income received by people on a regular basis, excluding certain lump-sum payments and excluding capital gains.
Mathematically, some definition denies "income" to households, depressing that statistic, relative to all others (even direct wages per worker). Overall, there are a slew of indicators (GDP per capita, wages per worker, income per household). Most are surging; the most depressed has stalled out, but still at or near the highest levels ever. There seems little grounds for complaining on this issue:
householdincomevspi.png
Adding (net) welfare receipts, to HI, yields the following figure. HI + welfare has continued increasing, even after 2000, when HI stabilized:
hipiwelfare.png


Personal income in the United States - Wikipedia, the free encyclopedia

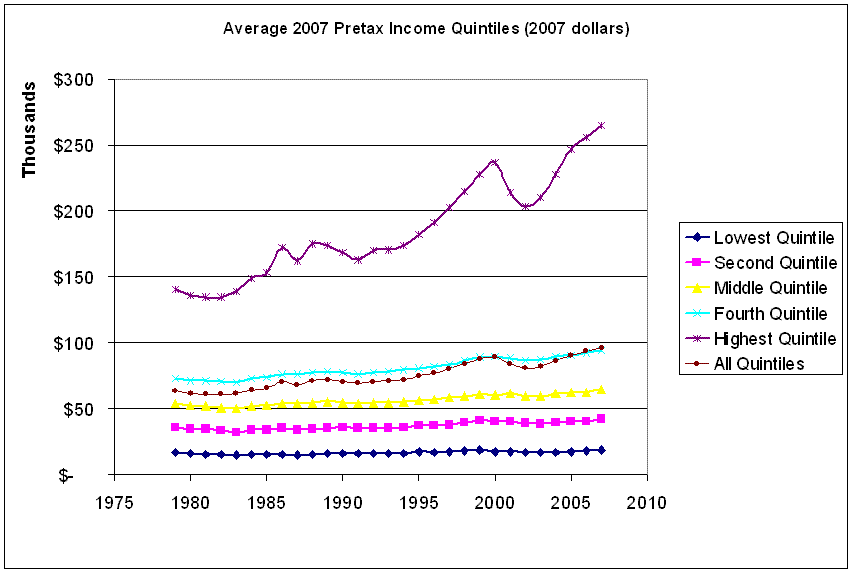
Here is the average pretax income quitiles available at CBO | Average Federal Taxes by Income Group. The data comes from the SOI combined with the CPS.

AvgIncomeQuintiles2007All.gif


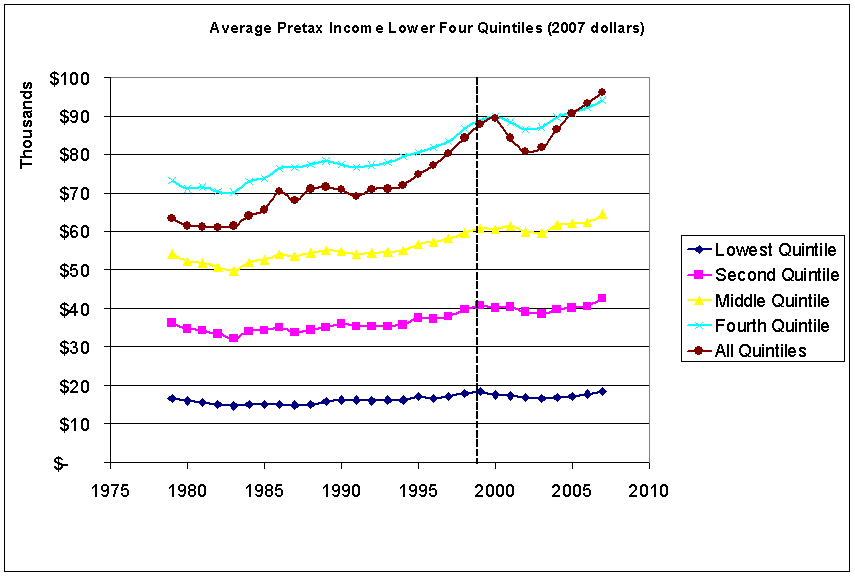
For clarity, just the top four are shown here;

AvgIncomeQuintiles2007Four.gif


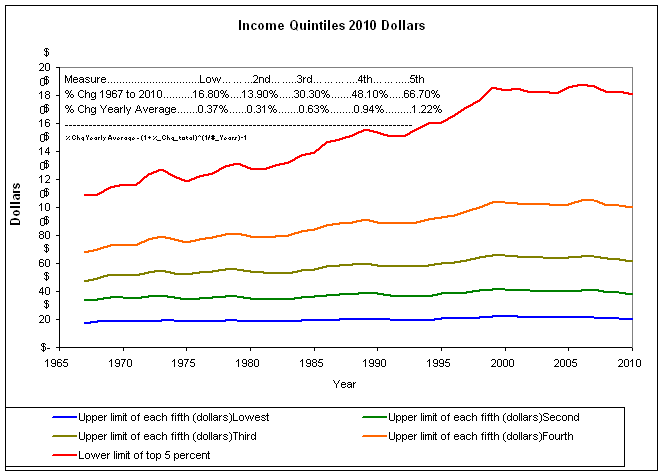
Curiously, the trend is a bit different from the upper limits for each quintile.

000-00IncomeQuitines.gif


They aren't, unfortunately, directly comparable on a numerical basis because one is in 2010 dollars, the other in 2007. Even adjusting for CPI, there is a slight oddity in that one of the averages exceeds the upper limit for the quintile. I included the average for all quintiles. Notice how it continues to trend upward, even though the lower quintiles have stalled.

Total income is pretty meaningless. Population grows. A single aggragate average is also not meaningful.

The only meaning full statistics are grouped household and individual. Quintiles appears to be the standard.
 
The differences between HI (CB) and PI (BEA) are:
HI = PI - pensions - welfare - capital gains​
Pensions ("employer contributions") include Social Security, employer pension plans. Welfare ("transfer receipts") include unemployment compensation. Capital gains include profits on sales of stock & real-estate. PI less pensions less welfare closely matches HI, with the residual difference easily explicable as capital gains:
hivspipensionswelfare.png
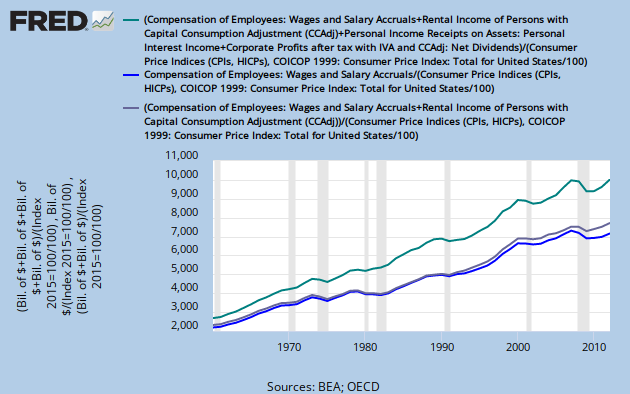
Indeed, comparing real wages, real wages plus rents, and real wages plus rents plus interest & dividends, rental incomes have stagnated since 2000:
fredgraph.png
 
Increased demand is obviously necessary;

This is especially true given that increased demand for housing caused the current depression!!

Also, it is especially true that the way to cure a drug addict is with more drugs


First of all, your assertions are irrelevant to my statement. Second of all, neither statement is true, assuming that the 2nd one is about more demand being counter productive to the economy.

There were many factors involved in the housing bubble and the resultant credit crisis, not least of which was poor governance over the previous couple of decades by both political parties. The demand for housing has always been strong, you could claim that policies that made it easier to get an ARM, but then saying that caused the whole thing to collapse is a bit of a stretch.
 
First of all, your assertions are irrelevant to my statement.

you forgot to say what statement??? I quote your statement exactly!!!


Second of all, neither statement is true, assuming that the 2nd one is about more demand being counter productive to the economy.

dear you forgot to say way the are not true???? Why bother?????


There were many factors involved in the housing bubble and the resultant credit crisis, not least of which was poor governance over the previous couple of decades by both political parties.

yes poor governance that organized much of the Federal and State governments to get people into homes that the free market said they could not afford. Why did you think the government was so involved?? For sport???

The demand for housing has always been strong, you could claim that policies that made it easier to get an ARM, but then saying that caused the whole thing to collapse is a bit of a stretch.[/QUOTE]

dear no one said that?? Are you drunk today??
 

Forum List

Back
Top