How deniers view Global Warming...

Billy_Bob

Diamond Member
Sep 4, 2014
30,837
20,605
1,945
Top Of The Great Divide
I just could not resist thumping on Skeptical Science (John Cooks) blog. As he deletes all non-agenda approved comments I thought it fitting to show just how ridicules the CAGW myth is.


The video is about 2 min 40 seconds and it shows how the alarmists use spinets of a small time frame to give you the illusion of catastrophic warming. Just like Michale Mann used a first year statisticians parlor trick to create the hockey stick (using 300 year plots of time samples before 1900 and 10 year plots after and never showing the change in his legend) this puts a little perspective in to real life and real time,

Or as i like to say "Context is everything only if it is in context".
 
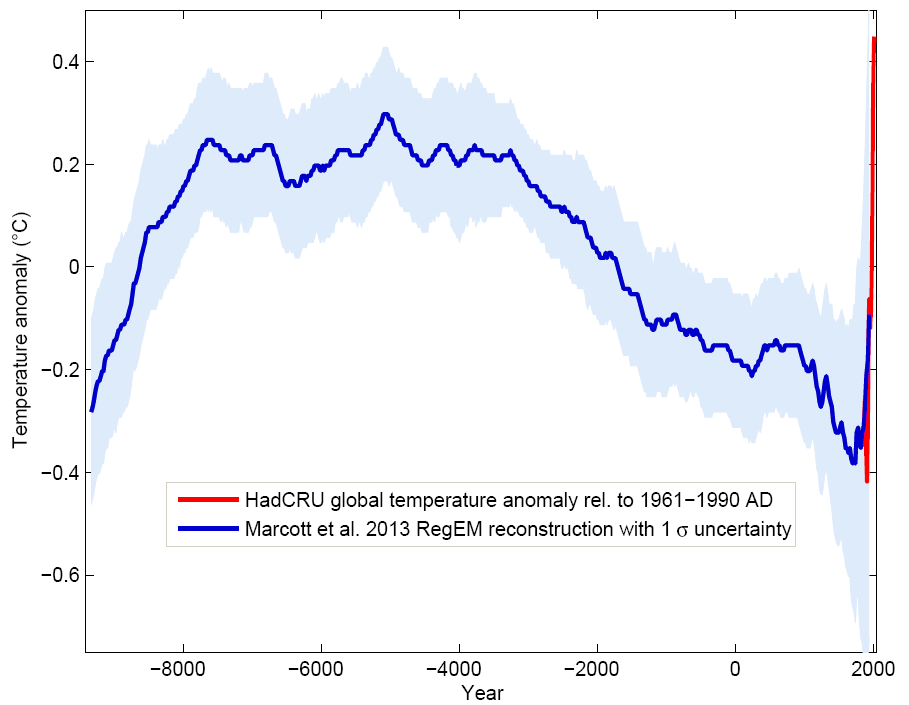
I'm sure a fellow as smart as you noticed that the long term graph was labeled "Greenland Dome". It was not global temperatures as were Cook and Nuccitelli's well known escalator graph. Here's a graph of global temperatures throughout the Holocene to the present. These data are from Shaun Marcott's work. I'm sure your familiar with Shaun Marcott.

Marcott.png


Note that the HadCRU data to 1990 is well above any prior temperature in the Holocene.
 
Reminds me of the curtain scene in the wizard of Oz..
However -- I must be a denier on STEROIDS because I don't even buy the juvenile expectation that ANY forcing function on Climate needs to LOOK LIKE the temperature result. Any scientist with a background in Linear, Non-linear, Stochastic Systems Analysis will tell you that a system as complex as the Earth Climate with various LARGE storage elements and CENTURY long thermal delays WILL NEVER produce an output that is correlated or phased to the input..

So superimposing a graph of ANY potential forcing over a temperature curve -- just makes me giggle a bit..
 
I'm sure a fellow as smart as you noticed that the long term graph was labeled "Greenland Dome". It was not global temperatures. Here's a graph of global temperatures throughout the Holocene to the present. These data are from Shaun Marcott's work. I'm sure your familiar with Shaun Marcott.

Marcott.png


Note that the HadCRU data to 1990 is well above any prior temperature in the Holocene.

Do I need to quote Marcott AGAIN to you ?? About the lack of any resolution in his GLOBAL attempts at reconstruction?? Couldn't EVER see a 100 yr event in the result. Scaling dude.. That's why the intro video is a laugh riot...
 
I guess from the "avoidance" of this thread by the usual suspects they are some what displeased with the fact that the rate of warming in the past is actually greater than our current trend has been. Now that we are again cooling its just going to get worse as the CAGW faithful are dropped onto the floor by their religion.
 
I'm sure a fellow as smart as you noticed that the long term graph was labeled "Greenland Dome". It was not global temperatures as were Cook and Nuccitelli's well known escalator graph. Here's a graph of global temperatures throughout the Holocene to the present. These data are from Shaun Marcott's work. I'm sure your familiar with Shaun Marcott.

Marcott.png


Note that the HadCRU data to 1990 is well above any prior temperature in the Holocene.

Your actually quoting Marcott Et Al.... :dig: I thought you had learned not to quote discredited papers..

Let me help you.

Holecene 2.JPG
 
Reminds me of the curtain scene in the wizard of Oz..
However -- I must be a denier on STEROIDS because I don't even buy the juvenile expectation that ANY forcing function on Climate needs to LOOK LIKE the temperature result. Any scientist with a background in Linear, Non-linear, Stochastic Systems Analysis will tell you that a system as complex as the Earth Climate with various LARGE storage elements and CENTURY long thermal delays WILL NEVER produce an output that is correlated or phased to the input..

So superimposing a graph of ANY potential forcing over a temperature curve -- just makes me giggle a bit..

And you have some nonlinear, stochastic method to make 1 watt of forcing do the work of ten?

And, just for the GIGGLES, where did anyone plot forcing over temperature in this thread?
 
I'm sure a fellow as smart as you noticed that the long term graph was labeled "Greenland Dome". It was not global temperatures as were Cook and Nuccitelli's well known escalator graph. Here's a graph of global temperatures throughout the Holocene to the present. These data are from Shaun Marcott's work. I'm sure your familiar with Shaun Marcott.

Marcott.png


Note that the HadCRU data to 1990 is well above any prior temperature in the Holocene.

Your actually quoting Marcott Et Al.... I thought you had learned not to quote discredited papers..

Show us a reliable source that says Marcott is discredited. His paper below is cited by 136 related articles. And, coming from a man who doesn't seem to have a single link to anything, it's a bit hard to take.

A Reconstruction of Regional and Global Temperature for the Past 11 300 Years
 
Reminds me of the curtain scene in the wizard of Oz..
However -- I must be a denier on STEROIDS because I don't even buy the juvenile expectation that ANY forcing function on Climate needs to LOOK LIKE the temperature result. Any scientist with a background in Linear, Non-linear, Stochastic Systems Analysis will tell you that a system as complex as the Earth Climate with various LARGE storage elements and CENTURY long thermal delays WILL NEVER produce an output that is correlated or phased to the input..

So superimposing a graph of ANY potential forcing over a temperature curve -- just makes me giggle a bit..

And you have some nonlinear, stochastic method to make 1 watt of forcing do the work of ten?

And, just for the GIGGLES, where did anyone plot forcing over temperature in this thread?

Thanks for confirming that you didn't watch the OP video Jimminy.. :lol:
You are a piece of work of some type.

I certainly DO have a way of DISTRIBUTING 10W of forcing over MANY decades or even centuries. AND to make the temperature CONTINUE to rise or fall EVEN WHEN the forcing is static.. To YOU -- it would just look like magic tho...

:lmao: :lmao: :lmao:
 
I'm sure a fellow as smart as you noticed that the long term graph was labeled "Greenland Dome". It was not global temperatures as were Cook and Nuccitelli's well known escalator graph. Here's a graph of global temperatures throughout the Holocene to the present. These data are from Shaun Marcott's work. I'm sure your familiar with Shaun Marcott.

Marcott.png


Note that the HadCRU data to 1990 is well above any prior temperature in the Holocene.

Your actually quoting Marcott Et Al.... I thought you had learned not to quote discredited papers..

Show us a reliable source that says Marcott is discredited. His paper below is cited by 136 related articles. And, coming from a man who doesn't seem to have a single link to anything, it's a bit hard to take.

A Reconstruction of Regional and Global Temperature for the Past 11 300 Years

I wouldn't go as far to say as "discreted"... I would say --

"badly misinterpreted on purpose"

" a fools errand to do attempt a GLOBAL reconstruction with sketchy and sparse evidence"

"not NEAR enough temporal resolution (or temperature resolution) to make comparisons to the current era"

And ALL of those would be correct.
 
I'm sure a fellow as smart as you noticed that the long term graph was labeled "Greenland Dome". It was not global temperatures as were Cook and Nuccitelli's well known escalator graph. Here's a graph of global temperatures throughout the Holocene to the present. These data are from Shaun Marcott's work. I'm sure your familiar with Shaun Marcott.

Marcott.png


Note that the HadCRU data to 1990 is well above any prior temperature in the Holocene.

Your actually quoting Marcott Et Al.... I thought you had learned not to quote discredited papers..

Show us a reliable source that says Marcott is discredited. His paper below is cited by 136 related articles. And, coming from a man who doesn't seem to have a single link to anything, it's a bit hard to take.

A Reconstruction of Regional and Global Temperature for the Past 11 300 Years
In 1991 the National Research Council proposed what has come to be a widely accepted definition of misconduct in science:
Misconduct in science is defined as fabrication, falsification, or plagiarism, in proposing, performing, or reporting research. Misconduct in science does not include errors of judgment; errors in the recording, selection, or analysis of data; differences in opinions involving the interpretation of data; or misconduct unrelated to the research process. Arguments over data and methods are the lifeblood of science, and are not instances of misconduct.

However, here I document the gross misrepresentation of the findings of a recent scientific paper via press release which appears to skirt awfully close to crossing the line into research misconduct, as defined by the NRC. I recommend steps to fix this mess, saving face for all involved, and a chance for this small part of the climate community to take a step back toward unambiguous scientific integrity.

The paper I refer to is by Marcott et al. 2013, published recently in Science. A press release issued by the National Science Foundation, which funded the research, explains the core methodology and key conclusion of the paper as follows (emphasis added):

source

It is far worse than simply being discredited....
 
I guess I should have pointed out that "reliable source" would be another peer reviewed study by Marcott's peers or betters (something like the 136 papers that cited Marcott et al 2013), not a denier blog. Roger Pielke Jr. has a bachelor's in math. The rest of his education is in public policy and political science. He lacks any qualification to judge Marcott's work and this article is nothing but a critique of Marcott's presentations.

You haven't got shit.
 
Reminds me of the curtain scene in the wizard of Oz..
However -- I must be a denier on STEROIDS because I don't even buy the juvenile expectation that ANY forcing function on Climate needs to LOOK LIKE the temperature result. Any scientist with a background in Linear, Non-linear, Stochastic Systems Analysis will tell you that a system as complex as the Earth Climate with various LARGE storage elements and CENTURY long thermal delays WILL NEVER produce an output that is correlated or phased to the input..

So superimposing a graph of ANY potential forcing over a temperature curve -- just makes me giggle a bit..

And you have some nonlinear, stochastic method to make 1 watt of forcing do the work of ten?

And, just for the GIGGLES, where did anyone plot forcing over temperature in this thread?

Thanks for confirming that you didn't watch the OP video Jimminy..
You are a piece of work of some type.

I certainly DO have a way of DISTRIBUTING 10W of forcing over MANY decades or even centuries. AND to make the temperature CONTINUE to rise or fall EVEN WHEN the forcing is static.. To YOU -- it would just look like magic tho...

It would look like magic to the experts as well cause the physics says you're full of shit.
 
I guess I should have pointed out that "reliable source" would be another peer reviewed study by Marcott's peers or betters (something like the 136 papers that cited Marcott et al 2013), not a denier blog. Roger Pielke Jr. has a bachelor's in math. The rest of his education is in public policy and political science. He lacks any qualification to judge Marcott's work and this article is nothing but a critique of Marcott's presentations.

You haven't got shit.

You gonna stay with gross misconduct and wishy washy crap... no surprise...
 
I'm sure a fellow as smart as you noticed that the long term graph was labeled "Greenland Dome". It was not global temperatures as were Cook and Nuccitelli's well known escalator graph. Here's a graph of global temperatures throughout the Holocene to the present. These data are from Shaun Marcott's work. I'm sure your familiar with Shaun Marcott.

Marcott.png


Note that the HadCRU data to 1990 is well above any prior temperature in the Holocene.

Your actually quoting Marcott Et Al.... I thought you had learned not to quote discredited papers..

Show us a reliable source that says Marcott is discredited. His paper below is cited by 136 related articles. And, coming from a man who doesn't seem to have a single link to anything, it's a bit hard to take.

A Reconstruction of Regional and Global Temperature for the Past 11 300 Years
In 1991 the National Research Council proposed what has come to be a widely accepted definition of misconduct in science:
Misconduct in science is defined as fabrication, falsification, or plagiarism, in proposing, performing, or reporting research. Misconduct in science does not include errors of judgment; errors in the recording, selection, or analysis of data; differences in opinions involving the interpretation of data; or misconduct unrelated to the research process. Arguments over data and methods are the lifeblood of science, and are not instances of misconduct.

However, here I document the gross misrepresentation of the findings of a recent scientific paper via press release which appears to skirt awfully close to crossing the line into research misconduct, as defined by the NRC. I recommend steps to fix this mess, saving face for all involved, and a chance for this small part of the climate community to take a step back toward unambiguous scientific integrity.

The paper I refer to is by Marcott et al. 2013, published recently in Science. A press release issued by the National Science Foundation, which funded the research, explains the core methodology and key conclusion of the paper as follows (emphasis added):

source

It is far worse than simply being discredited....

Let's just amplify a part of that for any handicapped in the hall..

.......the gross misrepresentation of the findings of a recent scientific paper via press release which appears to skirt awfully close to crossing the line into research misconduct,

Marcott just decided to slap up an attempt at a GLOBAL average temp from cruddy data. HE was HONEST about the limitations. It's the Circus of MORONS that made all kind of UNFOUNDED claims about what all that means --- that was disrespectful and dishonest with science..
 
Reminds me of the curtain scene in the wizard of Oz..
However -- I must be a denier on STEROIDS because I don't even buy the juvenile expectation that ANY forcing function on Climate needs to LOOK LIKE the temperature result. Any scientist with a background in Linear, Non-linear, Stochastic Systems Analysis will tell you that a system as complex as the Earth Climate with various LARGE storage elements and CENTURY long thermal delays WILL NEVER produce an output that is correlated or phased to the input..

So superimposing a graph of ANY potential forcing over a temperature curve -- just makes me giggle a bit..

And you have some nonlinear, stochastic method to make 1 watt of forcing do the work of ten?

And, just for the GIGGLES, where did anyone plot forcing over temperature in this thread?

Thanks for confirming that you didn't watch the OP video Jimminy..
You are a piece of work of some type.

I certainly DO have a way of DISTRIBUTING 10W of forcing over MANY decades or even centuries. AND to make the temperature CONTINUE to rise or fall EVEN WHEN the forcing is static.. To YOU -- it would just look like magic tho...

It would look like magic to the experts as well cause the physics says you're full of shit.

Wanna do this one Jimminy? Wanna look foolish again?
Do you not know about integrals and delays in systems analysis?

Wanna LEARN something? Of course ya don't.. :D
 
I'm sure a fellow as smart as you noticed that the long term graph was labeled "Greenland Dome". It was not global temperatures as were Cook and Nuccitelli's well known escalator graph. Here's a graph of global temperatures throughout the Holocene to the present. These data are from Shaun Marcott's work. I'm sure your familiar with Shaun Marcott.

Marcott.png


Note that the HadCRU data to 1990 is well above any prior temperature in the Holocene.

Your actually quoting Marcott Et Al.... I thought you had learned not to quote discredited papers..

Show us a reliable source that says Marcott is discredited. His paper below is cited by 136 related articles. And, coming from a man who doesn't seem to have a single link to anything, it's a bit hard to take.

A Reconstruction of Regional and Global Temperature for the Past 11 300 Years
In 1991 the National Research Council proposed what has come to be a widely accepted definition of misconduct in science:
Misconduct in science is defined as fabrication, falsification, or plagiarism, in proposing, performing, or reporting research. Misconduct in science does not include errors of judgment; errors in the recording, selection, or analysis of data; differences in opinions involving the interpretation of data; or misconduct unrelated to the research process. Arguments over data and methods are the lifeblood of science, and are not instances of misconduct.

However, here I document the gross misrepresentation of the findings of a recent scientific paper via press release which appears to skirt awfully close to crossing the line into research misconduct, as defined by the NRC. I recommend steps to fix this mess, saving face for all involved, and a chance for this small part of the climate community to take a step back toward unambiguous scientific integrity.

The paper I refer to is by Marcott et al. 2013, published recently in Science. A press release issued by the National Science Foundation, which funded the research, explains the core methodology and key conclusion of the paper as follows (emphasis added):

source

It is far worse than simply being discredited....

Let's just amplify a part of that for any handicapped in the hall..

.......the gross misrepresentation of the findings of a recent scientific paper via press release which appears to skirt awfully close to crossing the line into research misconduct,

Marcott just decided to slap up an attempt at a GLOBAL average temp from cruddy data. HE was HONEST about the limitations. It's the Circus of MORONS that made all kind of UNFOUNDED claims about what all that means --- that was disrespectful and dishonest with science..

Those Citing garbage as a foundation for their work are working on quicksand... and they are fools.... Marcott Et Al did away with the MEW and other warm periods that were inconvenient for the CAGW alarmists.. it was a train wreck from the word go.
 
Those Citing garbage as a foundation for their work are working on quicksand... and they are fools....

They're the ones with the PhDs, getting their work published in peer reviewed journals. Who the fuck are you?
 
Those Citing garbage as a foundation for their work are working on quicksand... and they are fools....

They're the ones with the PhDs, getting their work published in peer reviewed journals. Who the fuck are you?

Proof Positive that the Peer Review is PAL REVIEW and is broken.
I am a PHD in climate sciences. Specialty in Solar Sciences. And just who the hell are you?
 

Forum List

Back
Top