According to the NSDIC the sea ice is more than two standard deviations higher than normal.
Arctic Sea Ice News & Analysis
Arctic Sea Ice News & Analysis
Follow along with the video below to see how to install our site as a web app on your home screen.
Note: This feature may not be available in some browsers.
Interesting that you should mention sea ice, Walleyes.
http://arctic.atmos.uiuc.edu/cryosphere/IMAGES/global.daily.ice.area.withtrend.jpg
As you can see, the average of the sea ice has been consistantly below the mean for most of the last decade. Especially evident when you compare it to all the previous decades on that graph. In fact, since the Antarctic ice is two deviations above the norm, where must the Arctic Ice be to neutralize that figure? And if the Arctic Ice is that low, why is that? After all, you just posted a link claiming the Arctic Temps are lower than normal.
At the end of June, Southern Hemisphere mid-winter, the sea ice surrounding Antarctica was more than two standard deviations greater than normal. On June 30, Antarctic sea ice extent was 15.88 million square kilometers (6.13 million square miles), compared to the 1979 to 2000 average of 14.64 million square kilometers (5.65 million square miles) for that day.
While recent studies have shown that wintertime Antarctic sea ice has a weak upward trend, and substantial variability both within a year and from year to year, the differences between Arctic and Antarctic sea ice trends are not unexpected. Climate models consistently project that the Arctic will warm more quickly than the Antarctic, largely due to the strong climate feedbacks in the Arctic. Warming is amplified by the loss of ice cover in the Arctic Ocean in areas that had been ice-covered for decades, and by the warming of Arctic lands as snow cover is lost earlier and returns later than in recent decades.
Moreover, rising levels of greenhouse gases and the loss of stratospheric ozone appear to be affecting wind patterns around Antarctica. Shifts in this circulation are referred to as the Antarctic Oscillation (AAO). As greenhouse gases have increased, and especially when ozone is lost in spring, there is a tendency for these winds to strengthen (a positive AAO index). The net effect is to push sea ice eastward, and northward, increasing the ice extent. As the current sea ice anomaly has developed, the AAO index has been strongly positive. See the NOAA AAO Index Web site. For more information about the differences between sea ice dynamics in the Arctic and Antarctic, see the NSIDC All About Sea Ice Web site.
Interesting that you should mention sea ice, Walleyes.
http://arctic.atmos.uiuc.edu/cryosphere/IMAGES/global.daily.ice.area.withtrend.jpg
As you can see, the average of the sea ice has been consistantly below the mean for most of the last decade. Especially evident when you compare it to all the previous decades on that graph. In fact, since the Antarctic ice is two deviations above the norm, where must the Arctic Ice be to neutralize that figure? And if the Arctic Ice is that low, why is that? After all, you just posted a link claiming the Arctic Temps are lower than normal.
The Navy requires accurate sea ice information for their operations, and has spent a lot of effort over the years studying, measuring, and operating in Arctic ice both above and below, such as they did in the ICEX 2009 exercise.
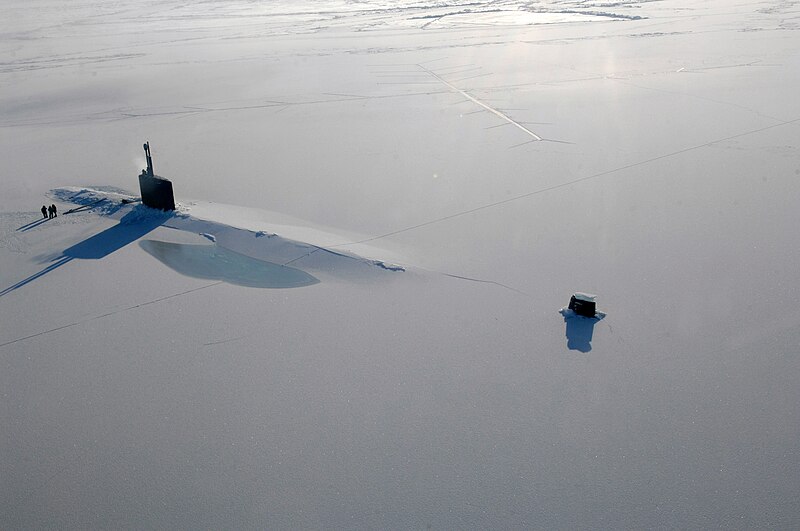
The US Navy attack submarine USS Annapolis (SSN 760) rests in the Arctic Ocean after surfacing through three feet of ice during Ice Exercise 2009 on March 21, 2009. The two-week training exercise, which is used to test submarine operability and war-fighting capability in Arctic conditions, also involved the USS Helena (SSN 725), the University of Washington and personnel from the Navy Arctic Submarine Laboratory.
So, if you are planning on bringing a $900 million Los Angeles class submarine through the ice, as the captain might say to the analyst after receiving an ice report: “you’d better be damn sure of the ice thickness before I risk the boat and the crew”.
Below is a blink comparator of U.S. Navy PIPS sea ice forecast data, zoomed to show the primary Arctic ice zone.