RollingThunder
Gold Member
- Mar 22, 2010
- 4,818
- 525
- 155
As many people have pointed out and satellite instrumentation confirms, the Earth is still gaining heat due to increased levels of atmospheric carbon dioxide and other greenhouse gases, even though the rise in surface temperatures has temporarily slowed down. A new study sheds further light on just where the heat has been going recently. These findings are not kind to the myths and delusions of the denier cultists, so howls of ignorant outrage and disbelief from these retarded reality deniers are only to be expected and will soon be seen here. This new research just confirms earlier findings and highlights what the climate scientists have been saying for years about the how the extra heat energy the Earth is retaining is affecting the whole system - the air, the oceans, the land, and the ice.
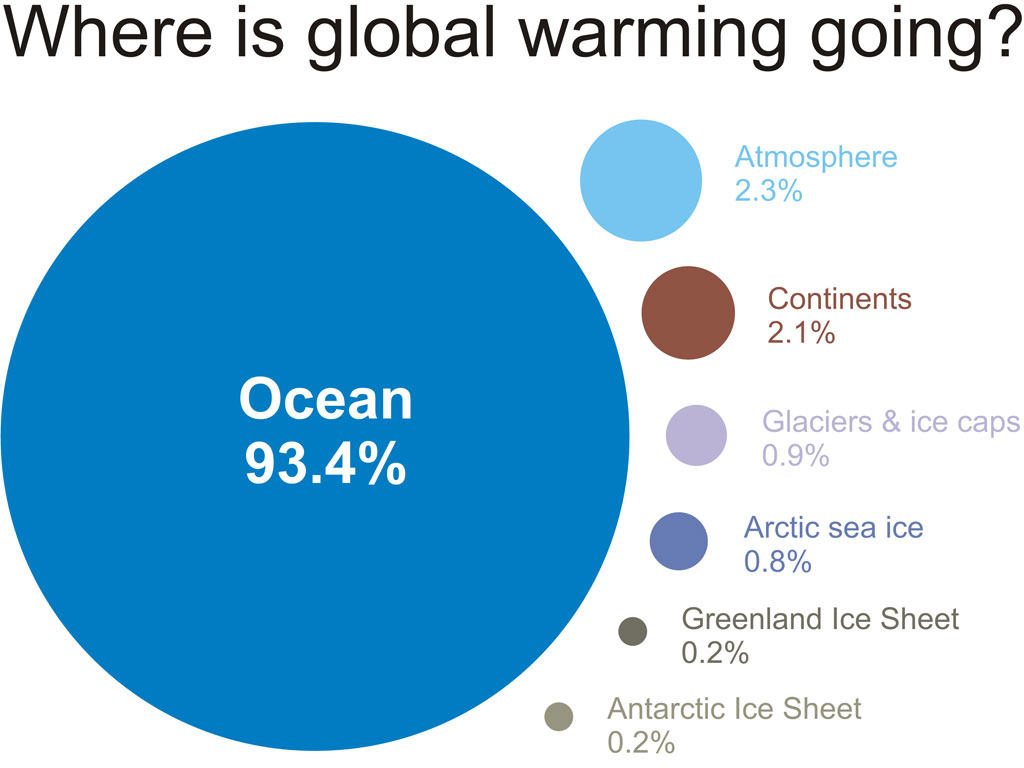
Most of the heat from global warming is going into the oceans. Covering some 70% of the Earth's surface and having a heat capacity a thousand times more than the atmosphere, it's easy to understand why the oceans are the main heat sink. (source)
******
******
New Research Confirms Global Warming Has Accelerated
SkepticalScience
25 March 2013
(excerpts)
A new study of ocean warming has just been published in Geophysical Research Letters by Balmaseda, Trenberth, and Källén (2013). There are several important conclusions which can be drawn from this paper.
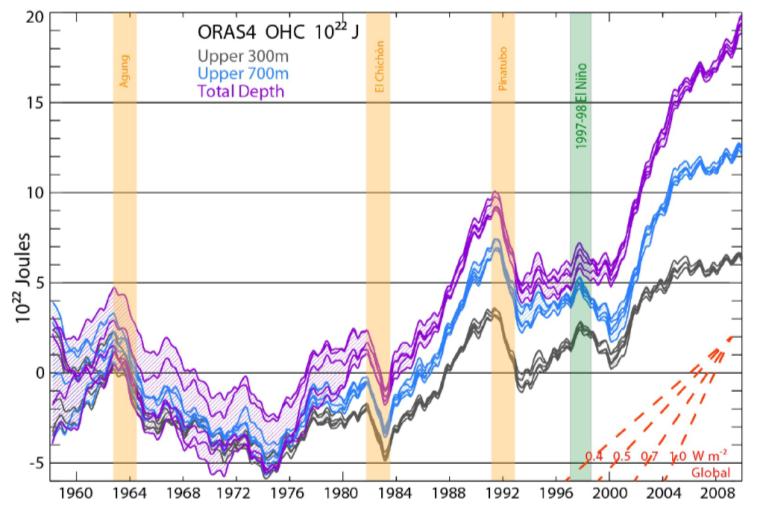
Figure 1: Ocean Heat Content from 0 to 300 meters (grey), 700 m (blue), and total depth (violet) from ORAS4, as represented by its 5 ensemble members. The time series show monthly anomalies smoothed with a 12-month running mean, with respect to the 19581965 base period. Hatching extends over the range of the ensemble members and hence the spread gives a measure of the uncertainty as represented by ORAS4 (which does not cover all sources of uncertainty). The vertical colored bars indicate a two year interval following the volcanic eruptions with a 6 month lead (owing to the 12-month running mean), and the 199798 El Niño event again with 6 months on either side. On lower right, the linear slope for a set of global heating rates (W/m[sup]2[/sup]) is given.
(continued in detail)
Most of the heat from global warming is going into the oceans. Covering some 70% of the Earth's surface and having a heat capacity a thousand times more than the atmosphere, it's easy to understand why the oceans are the main heat sink. (source)
******
******
New Research Confirms Global Warming Has Accelerated
SkepticalScience
25 March 2013
(excerpts)
A new study of ocean warming has just been published in Geophysical Research Letters by Balmaseda, Trenberth, and Källén (2013). There are several important conclusions which can be drawn from this paper.
- Completely contrary to the popular contrarian myth, global warming has accelerated, with more overall global warming in the past 15 years than the prior 15 years. This is because about 90% of overall global warming goes into heating the oceans, and the oceans have been warming dramatically.
- As suspected, much of the 'missing heat' Kevin Trenberth previously talked about has been found in the deep oceans. Consistent with the results of Nuccitelli et al. (2012), this study finds that 30% of the ocean warming over the past decade has occurred in the deeper oceans below 700 meters, which they note is unprecedented over at least the past half century.
- Some recent studies have concluded based on the slowed global surface warming over the past decade that the sensitivity of the climate to the increased greenhouse effect is somewhat lower than the IPCC best estimate. Those studies are fundamentally flawed because they do not account for the warming of the deep oceans.
- The slowed surface air warming over the past decade has lulled many people into a false and unwarranted sense of security.
Figure 1: Ocean Heat Content from 0 to 300 meters (grey), 700 m (blue), and total depth (violet) from ORAS4, as represented by its 5 ensemble members. The time series show monthly anomalies smoothed with a 12-month running mean, with respect to the 19581965 base period. Hatching extends over the range of the ensemble members and hence the spread gives a measure of the uncertainty as represented by ORAS4 (which does not cover all sources of uncertainty). The vertical colored bars indicate a two year interval following the volcanic eruptions with a 6 month lead (owing to the 12-month running mean), and the 199798 El Niño event again with 6 months on either side. On lower right, the linear slope for a set of global heating rates (W/m[sup]2[/sup]) is given.
(continued in detail)


